Analyzing Hive Job Failures
Note
If you face any intermittent lock or dead lock issues during the custom Hive metastore migration, see Intermittent Lock and Deadlock Issues in Hive Metastore Migration to resolve them.
When there is an issue with a Hive job, you can first start by analyzing the job’s logs and results.
To analyze a job, use the Analyze tab of the QDS user interface (UI). Perform the following steps:
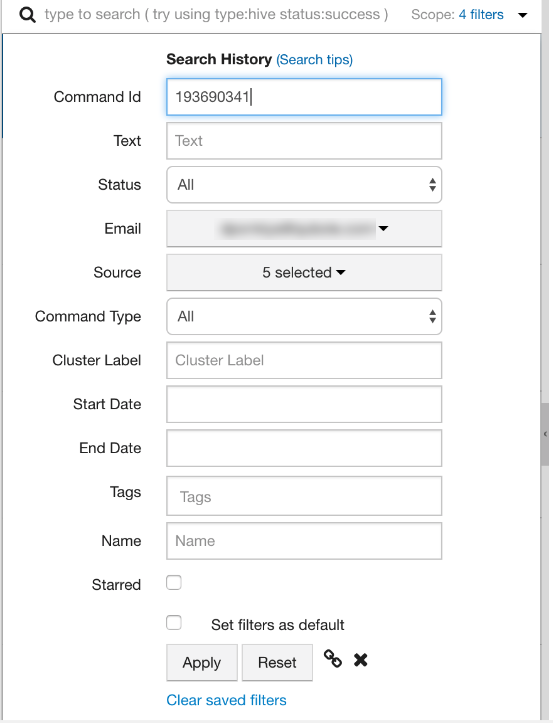
- Each Qubole job or command has a unique ID. Your can search a job using the command_id as depicted below.
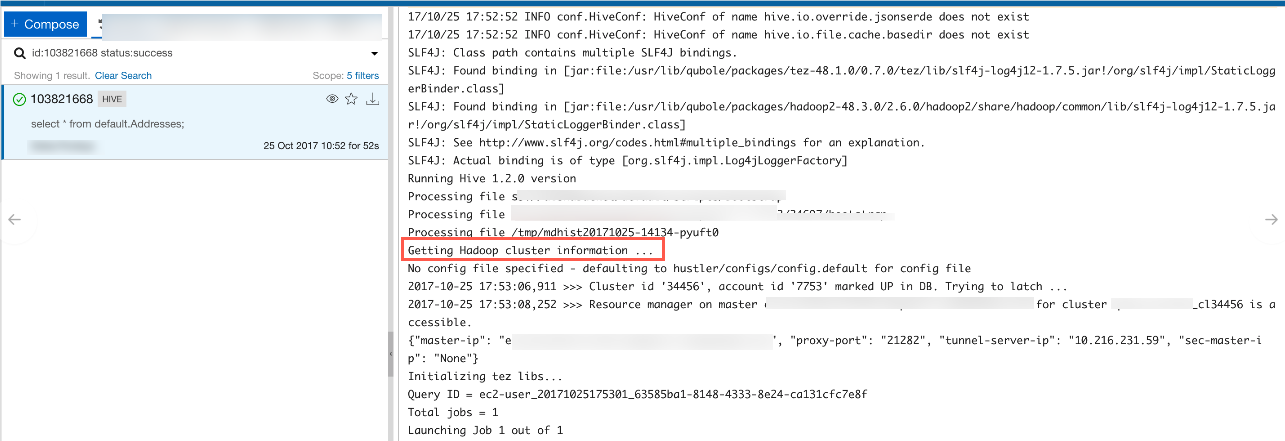
- Any Hive or shell command job contains the logs in the bottom-right section of the UI. Generally, these logs show the number of MapReduce jobs it is going to start and each MapReduce job has its own link Application UI that opens a new browser tab and displays the job details.
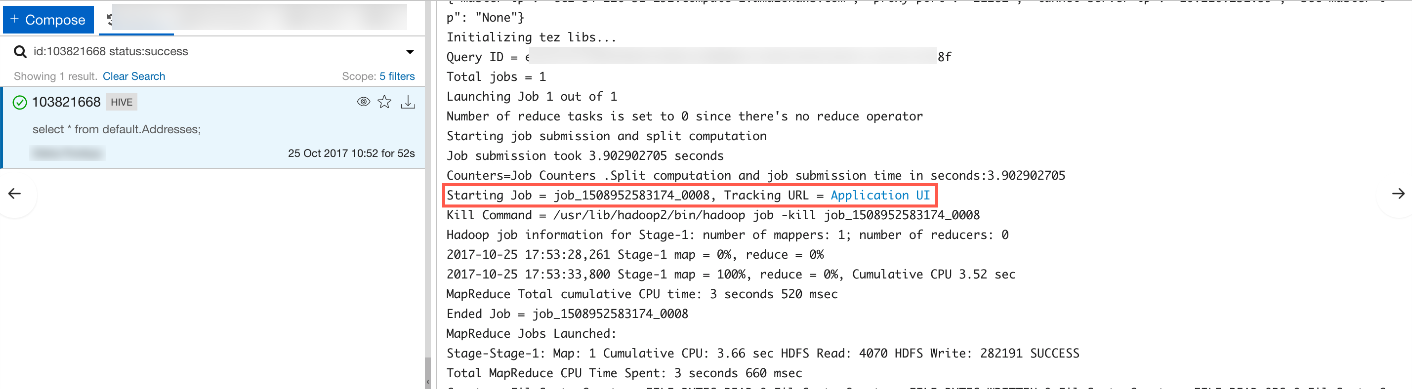
- The Application UI page shows important details as mentioned below:
- Job Status (Succeeded/Failed/Killed)
- Total Mapper/Reducer tasks
- Failed/Killed tasks
- Counter Link: this table shows very useful parameters, such as S3_bytes_read and file_bytes_written. These counters are very useful for understanding the nature of a job. For example, the counters provide details about how much data is being read, how much data is being written on HDFS or cloud object storage, and so on.
Intermittent Lock and Deadlock Issues in Hive Metastore Migration
To prevent intermittent lock and deadlock issues that occur during the migration from Qubole-managed Hive metastore to
custom-managed Hivmetastore, Qubole recommends you to set the SQL transaction isolation level to
READ COMMITTED.
The above configuration change may require restarting the RDS instance that hosts the metastore database.
For more information, see Migrating Data from Qubole Hive Metastore to a Custom Hive Metastore and Connecting to a Custom Hive Metastore.