Author and Execute Commands
Click Compose to display a query composer and editor. Use these to author and execute the following types of commands:
- Data Export
- Data Import
- DB query
- Hive Query
- Hadoop Job
- Pig Query
- Shell Command
- Presto Query
- Spark Command
- Redshift Query
- Query Export
- Refresh Table
- Workflow
Note
Not all of these are available on all Cloud platforms.
Hive Query is the default command type. Use the drop-down menu to choose a different type.
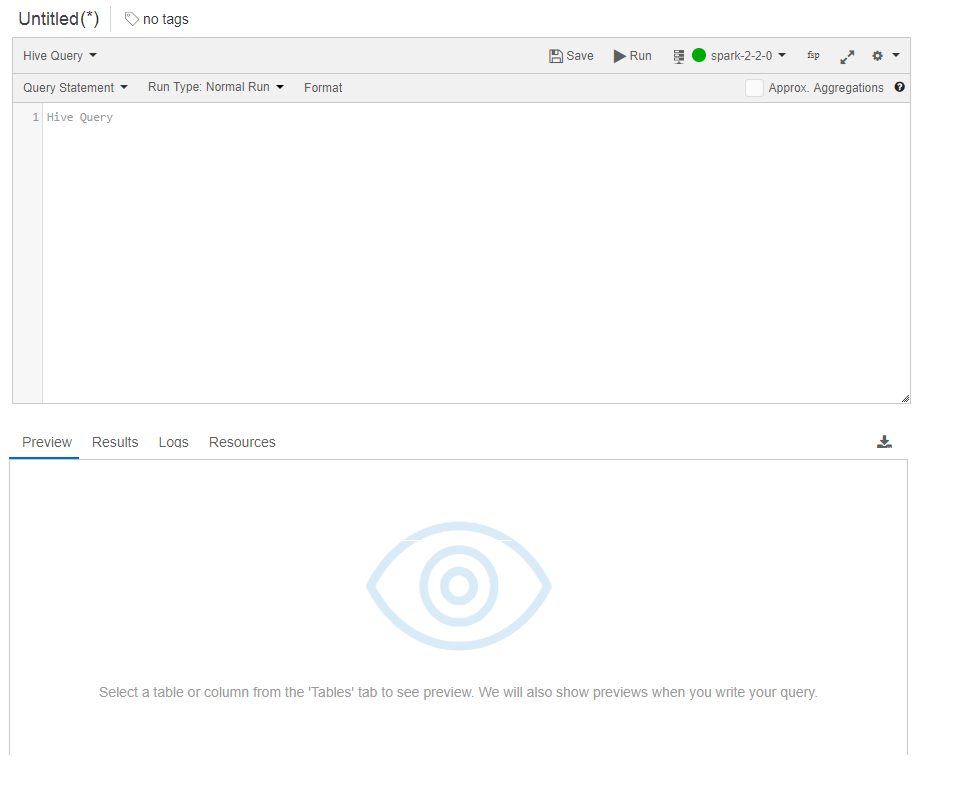
The command editor window allows you to compose various kinds of commands. As you run commands, you can the see Results and Logs under their respective tabs. The command editor has usability and developer productivity features such as highlighted syntax and auto-completion.
Commands run can be given a name and tagged with multiple tags. The command editor also allows choosing the cluster against which the command should be run. Hive and Presto Queries can also use an expression editor which allows evaluating an expression for a table or a column and shows the result. This can significantly cut down the time required to author queries because it reduces the time needed to discover bad expressions in a query. A typical workflow would involve you finessing the expressions that appear in queries through fast iterations in the Expression Evaluator before submitting a query to a Qubole cluster. Hive queries can be run in normal, constrained, and test mode as well.
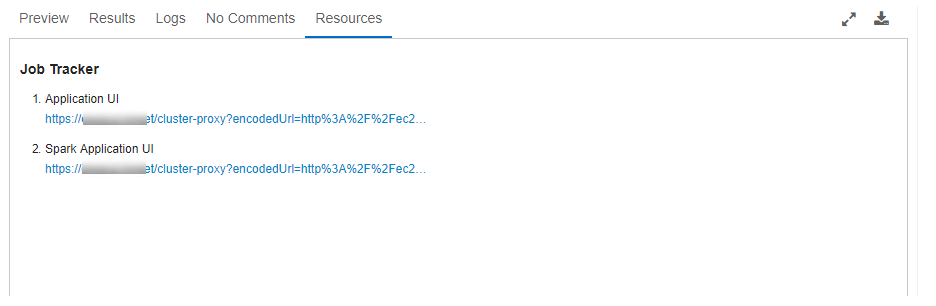
The Resources tab contains the Job Tracker URLs for Hadoop 1 jobs, Application Tracker URLs for Hadoop 2 and Spark jobs, and Spark Application UI URLs for Spark queries.
An example of Job Tracker URLs displayed in the Resources tab is shown in the following figure.
See the Getting Started for Hive and Hadoop command examples.
How to Use Auto-Completion and Suggestions
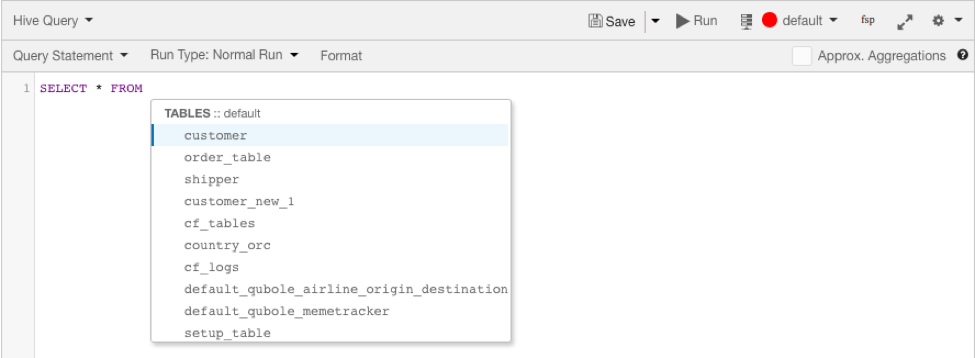
When composing a query, you can get help in the form of auto-completion and suggestions. For example, when you type SELECT,
QDS will prompt you with a list of columns and keywords. In addition, QDS can suggest commonly used tables and columns.
Auto-completion and suggestions are available in the following forms:
Table Suggestions
Hot tables, or most-used tables by total query count, are suggested in the query composer when it detects the keywords
FROM or JOIN. Table suggestions are currently limited to the top 100 tables.
Table suggestions are ordered based on usage count– the number of times the table was used in past queries.
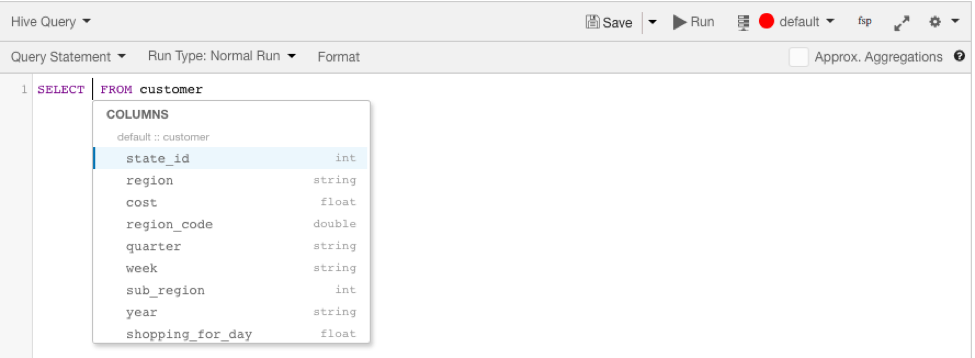
Hot columns, or most-used columns amongst tables in the query of interest, are suggested in the query composer. Column suggestions are limited to the top 4 columns from each of the top 100 hot tables.
Column suggestions are ordered according to usage count– the number of times the column was used in queries.
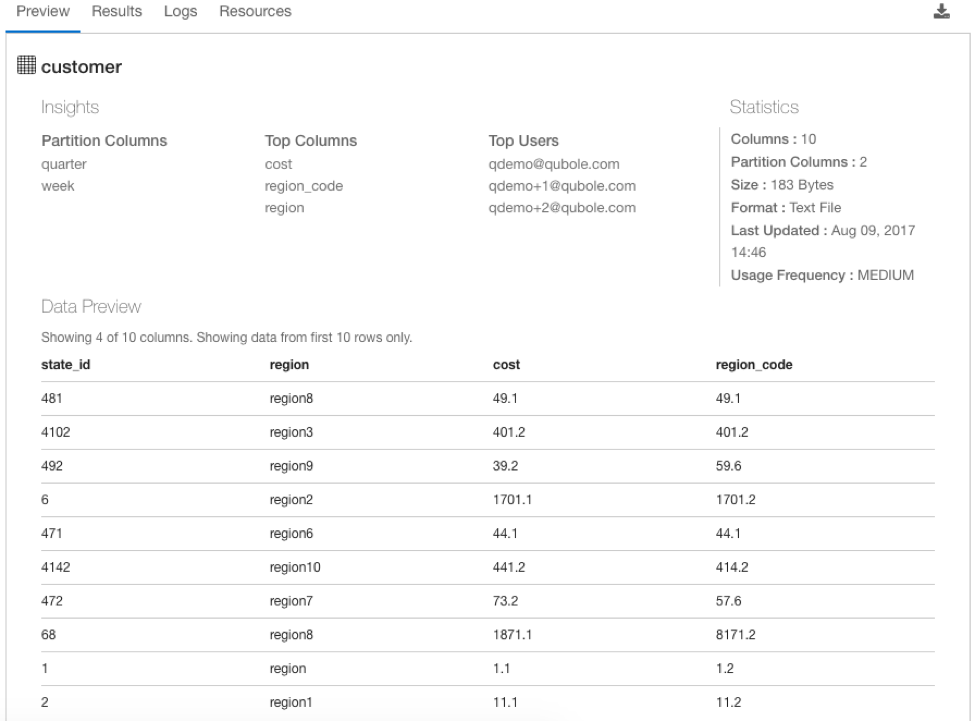
Preview Tab
The Preview tab provides table and column usage insights, statistics, and sample data for a table or column.
Table Preview
Left pane
- Partitioned columns: Listing of partitioned column numbers to help optimize queries by scanning less data.
- Top columns: Listing of most-used columns with deep links for queries that reference the table
- Top users: Listing of users who execute the most queries referencing the table
- Top filters: Listing of most commonly used predicates (logical expressions that evaluate to TRUE or FALSE) that reference the table
Statistics
Table statistics computed using a 90-day lookback period:
# Columns: Indicates the total number of columns in the table
# Rows: Indicates the total number of rows in the table
# Partitions: Indicates the total number of columns that the table is partitioned on
Table Size: Size on disk of all the records in the table
Table Format: File format in which table is stored (ORC, Parquet, etc.)
Table last updated: The date and time when the table record(s) were last updated
Usage Frequency: Table frequency can be one of the following:
- High: If the table usage is in the top 25%, as determined by the number of commands executed
- Medium: If the table usage is between the 25th and 75th percentile, as determined by the number of commands executed
- Low: If the table usage is in the lowest 25%, as determined by the number of commands executed
Data Preview
Preview of the first 10 rows in the table, allowing you to readily explore the records and values in the table, and eliminating the need for exploratory queries.
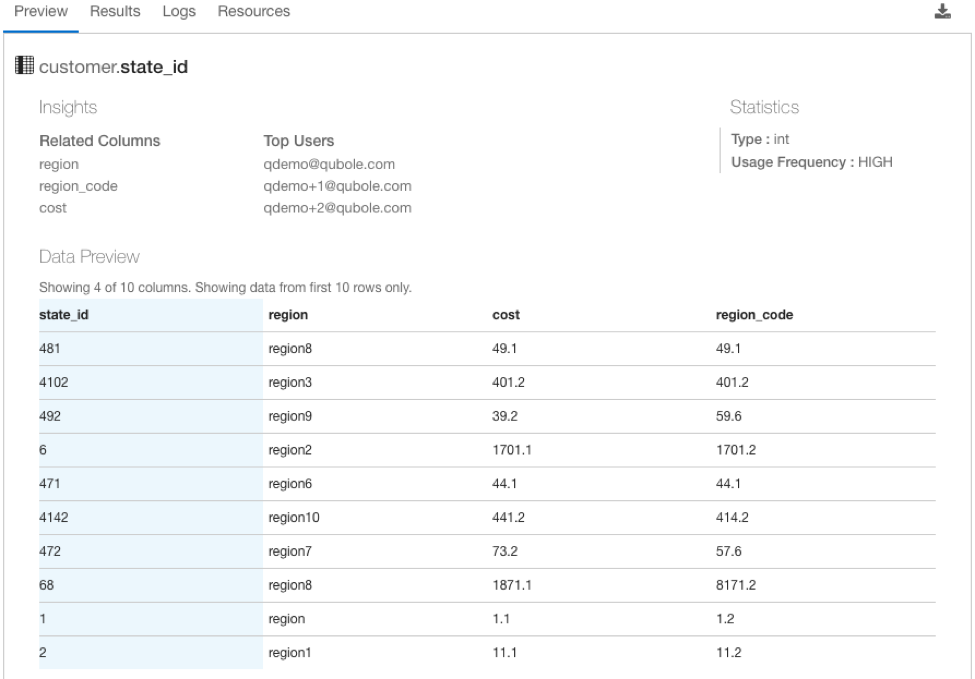
Column Preview
Left pane
- Related Columns : List of the top 3 columns used along with the selected column
- Top Users: List of users who most frequently execute queries referencing the column
Statistics
Column statistics computed using a 90-day lookback period:
- # Rows : Total number of rows or records in the table
- # Unique rows: Total number of unique column values, or column cardinality.
- Type : Data type of column values (string, text, integer, date, etc.)
- Usage Frequency: Column frequency can be one of the following:
- High: If the column usage is in the top 25%, as determined by the number of commands that include the parent table.
- Medium: If the column usage is between 25th and 75th percentile, as determined by the number of commands that include the parent table.
- Low: If the column usage is in the lowest 25%, as determined by the number of commands that include the parent table.
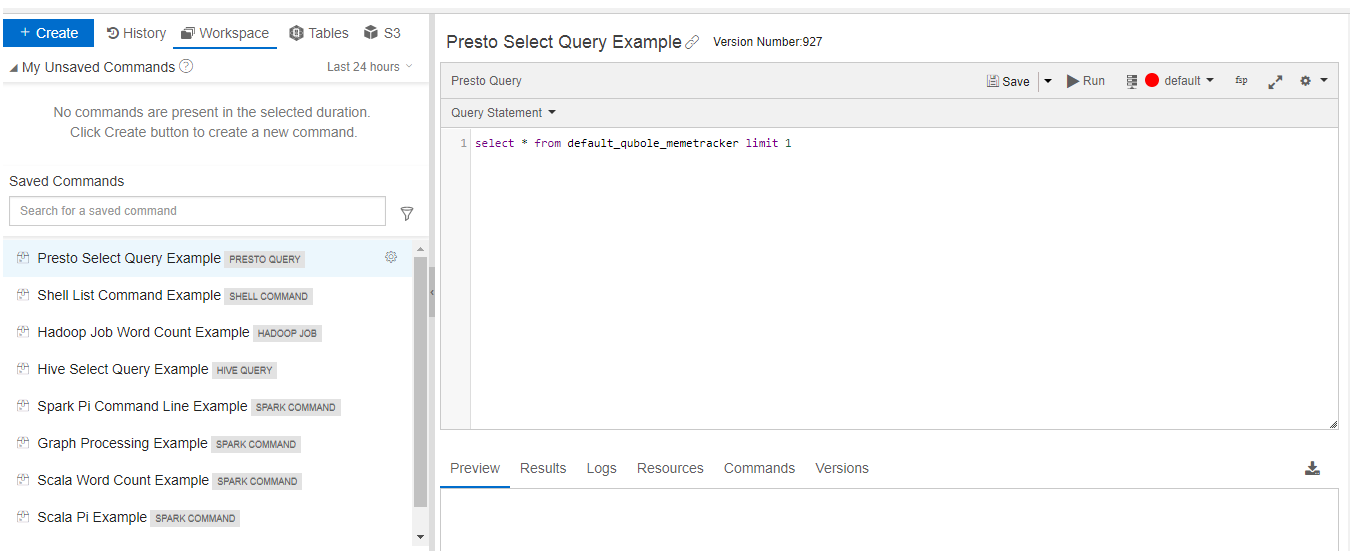
Workspace Tab
This tab shows saved queries from the Compose tab.
Note
To avoid other users from seeing your commands, assign other users a policy for Command Resource with
only create permission in Control Panel > Manage Roles. With this policy, other users can create
a command but denied access to see other users’ commands. For more information, see Resources, Actions, and What they Mean.
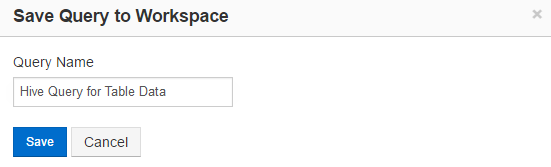
You can save a query after creating it in the query composer: after running a query, click Save if you want to rerun it or refer to it later. Clicking Save brings up the Save Query to Workspace dialog. Enter a name for the query.
Alternatively, click Create to compose a new command and save it to run the command later in case if you do not want to run it immediately.
The Query Name field does not accept any of the following:
- & (ampersand)
- < (less than)
- > (greater than)
- ” (double quotes)
- ‘ (single quote)
- HTML tags
It can contain a maximum of 255 characters.
For a current user, you can now see the unsaved commands in the Workspace tab under My Unsaved Commands for a maximum period of 30 days. The default time period is Last 24 Hours and the third option in the drop-down list to see unsaved commands for the current user is Last 48 Hours.
QDS displays command runs, logs and results for Saved Commands.
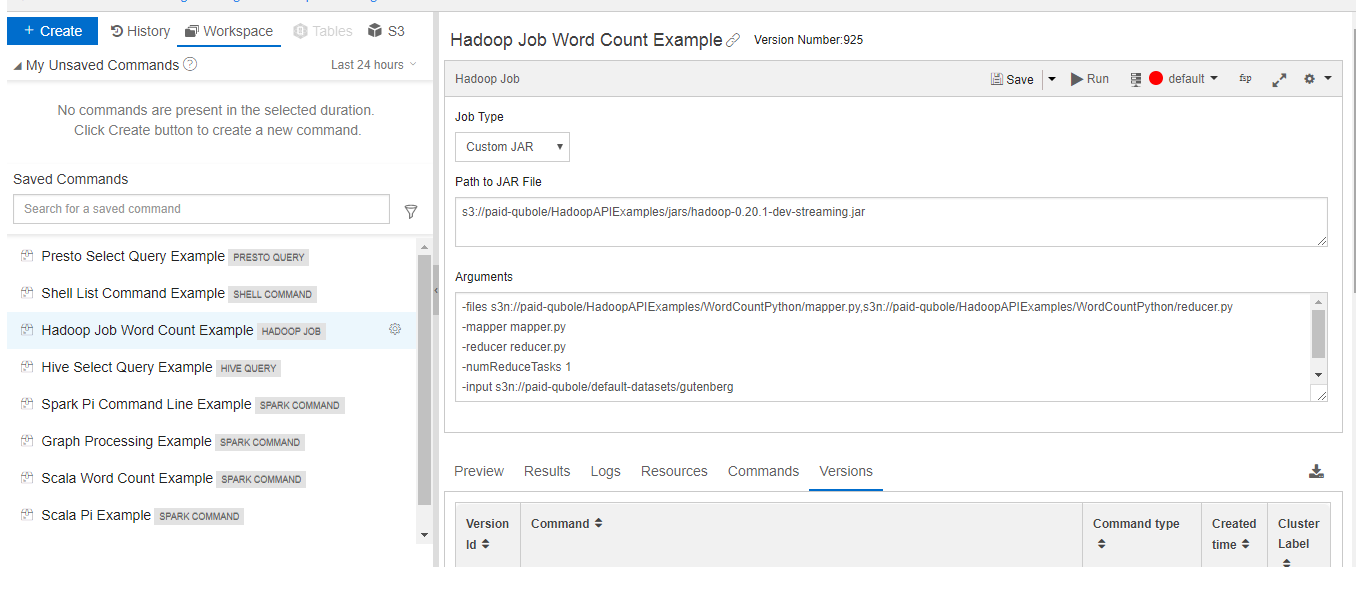
About Saved Query Examples
QDS provides example saved queries of different command types in the Workspace tab of a new QDS account. The examples are as shown below.
However, in case of the Hadoop saved query example, you must change the output directory before executing the same query that is the output directory that is shown below.
Changing Saved Query Names
To change a query name, choose the query in the Workspace tab; the query is displayed in the query composer.
Hover your mouse over the query name (at the top of the right pane) to get an edit icon  .
.
Click the edit icon to make the query name editable.
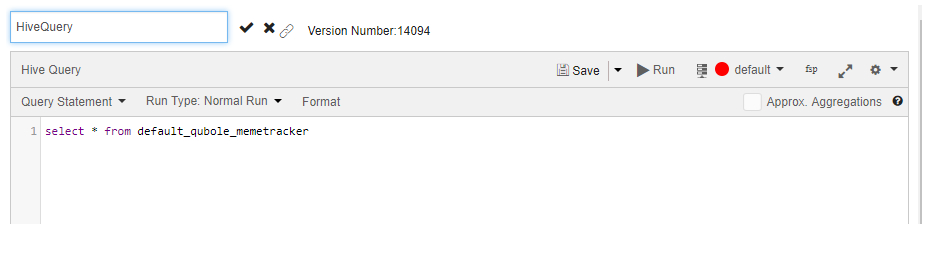
After changing the query name, click the check mark symbol  to save it.
Click the cross mark symbol  to cancel saving the new query name.
Alternatively, you can also click the settings icon against each query name in the left pane. A list gets displayed with Rename and Archive as two options. Click Rename and the Save Query to Workspace dialog is displayed. Type the new name in the text field and click Save. (You can click Cancel to go back to the previous tab.)
You can also save and run a query. So, choose the query in the Workspace tab; the query is displayed in the query composer. Edit the query and click Run. Qubole automatically saves and runs the query.
Click the permalink icon  to see the query’s permalink.
Against the query name, you can see the command and version IDs.
For each saved query, you can see the date and time at which the query was run. Choose a query in the Workspace tab and look under the Commands tab below the query composer; for example.
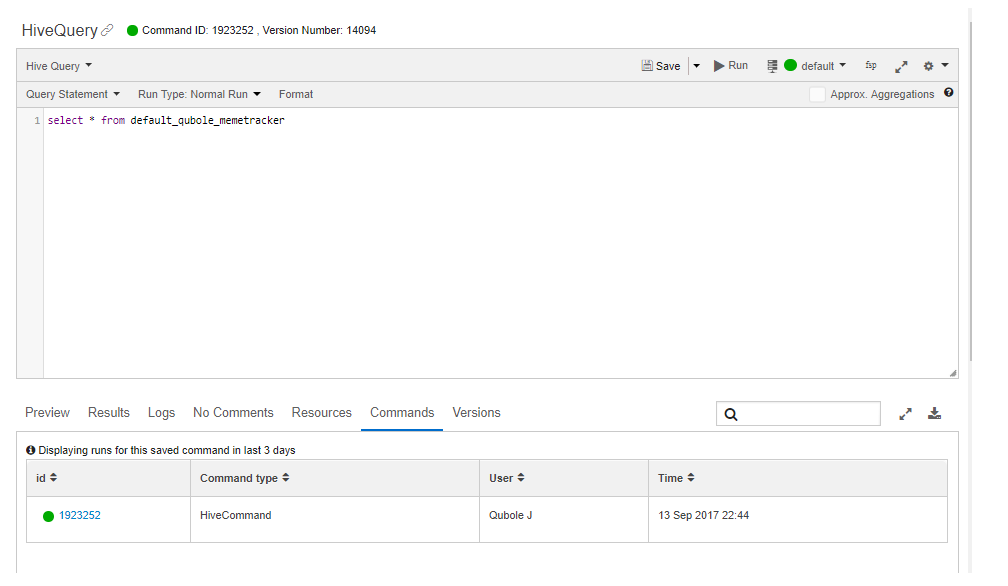
You can also see the command’s result and logs in the Results and Logs tabs.
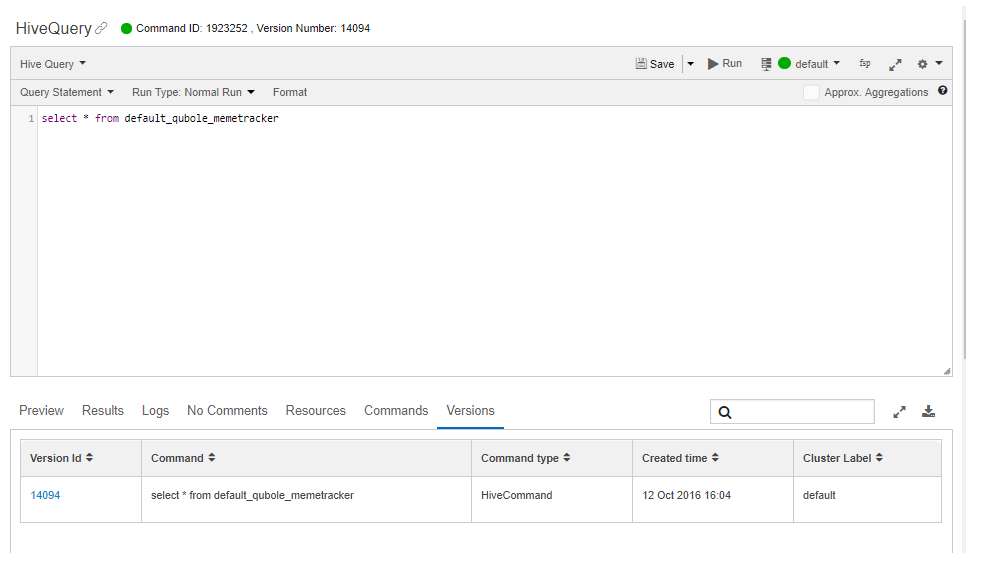
You can edit the saved query and save it again. Saving the edited query creates different versions that are maintained under the Versions tab, for example.
If a command as a saved query in Workspace was run before, Qubole loads its latest run’s logs and results. If you run a command from Workspace, Qubole auto refreshes the command results and logs similar to how it is done in the History tab.
Archiving a Saved Query
In the left pane of the Workspace tab, click the settings icon against the saved query that you want to archive. From the drop-down list displayed, click Archive. A dialog that wants you to confirm to archive that saved query is displayed. Click OK to archive the saved query. This removes that specific query from the active saved-query list.
In the left pane of the Workspace tab, there is a filter icon using which you can see the archived queries.
Replicating a Saved Query
To replicate an existing saved query in Workspace as a separate saved query, pull the downward arrow against Save in the Analyze query composer. Click Save as. The Save Query to Workspace dialog is displayed. Type the query name in the text field and click Save to add that query as a new saved query to the list in Workspace. (You can click Cancel to go back to the previous tab.)
Results and Logs Tabs
Downloading Results and Logs and Downloading the Complete Raw Result describes how to download results and logs from Analyze.
Blob Tab (Azure)
Use this tab to browse Azure blob storage and examine the directories and files.
Object Store Tab (Oracle OCI)
Use this tab to browse Oracle OCI object storage and examine the directories and files.
Object Store Tab (Oracle OCI Classic)
Use this tab to browse Oracle OCI Classic object storage and examine the directories and files.