Health Checks for Clusters
This section explains the various health checks configured for the clusters.
Cluster HDFS Disk Utilization
This alert checks the free space allotted to HDFS and sends an alert if the free space is lower than a configurable limit.
Node Disk Utilization
This alert checks the free space allotted to HDFS on each node of the cluster and sends an alert if the free space is lower than a configurable limit.
Simple Hadoop Job Probe
This alert probes a simple end-to-end hadoop job in the cluster to check the overall health of the cluster.
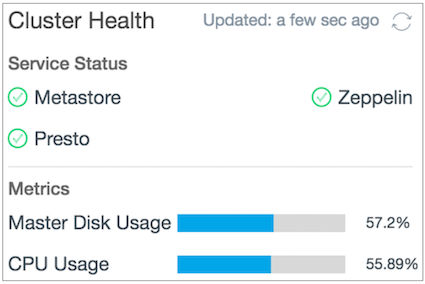
Describing Cluster Health Data from the UI
The Cluster health data is available (on AWS only) for you only when the cluster is up.
The Cluster Health data displays the status of the services and metrics. The services are displayed under the Service Status section in binary values (red and green). The green color indicates that the service is running properly whereas the red color denotes that it is not running in an optimal state. Under the Metrics section, the status of the metrics are displayed in percentage (%). The percentage bar becomes red when the CPU and Disk Usage metrics become 90% or more.
Metrics and Services Available on Clusters
Note
YARN-based metrics are only available when Ganglia is enabled on the cluster.
| Metrics/Service | Available On Cluster Type |
|---|---|
| Binary Metrics (Services) | |
| Hive Metastore | All |
| Name Node | Hive, Spark |
| Resource Manager | Hive, Spark |
| HS2 | Hive (HS2 enabled on coordinator) |
| Zeppelin | Spark, Presto |
| Presto | Presto |
| Bar Metrics (Float) | |
| CPU Usage | All (coordinator node’s CPU usage) |
| Coordinator Disk Usage | All |
| Spot nodes lost count (Integer) | All |
| Heap Information (All heap metrics are calculated from jstat command) | |
| Hive Metastore Heap | All |
| HS2 Heap | Hive (HS2 enabled on Coordinator) |
| Presto Heap | Presto |
| Zeppelin Heap | Presto, Spark |