Governing a Cluster on QDS
QDS has introduced a new cluster console providing granular visibility, enhanced governance, and ease of use. It supports governing and administering a cluster’s activity and tracking the snapshot of its modified configuration on the Clusters UI page.
To track and govern a specific cluster’s activity, navigate to the Clusters page and click the cluster from the list that is displayed. Clicking a specific cluster displays its Overview page, which shows these details:
- Last Instance Status: It displays a snapshot of the last instance status. Click View Details for more information. Tracking Cluster Instances describes the cluster’s instances.
- Resources: It provides a list of resources available. Resources are only available for a running cluster.
- Current Composition: It displays a snapshot of the cluster composition. Click View Details for more information.
- Cluster Configuration: It provides a subset of the cluster configuration. Click VIEW ALL to see the complete configuration. Click Edit to modify the configuration. Tracking the History of Changes in Cluster Settings describes how to track the modified cluster settings.
- Activity: It is a list of events that have occurred on the cluster, which are available at the cluster level and the cluster instance level.
- Cluster Node Bootstrap: It provides a file path and a snapshot view of the bootstrap. Click Edit to add a bootstrap script.
- Cluster Permissions: It displays the list of permissions set on the cluster.
The Overview page is illustrated in this example.
A cluster dashboard is a collection ot tile cards that displays all the important information about the cluster. The tile cards can be customized by dragging and repositioning them. You can decide what information has the most significance and customize the dashboard accordingly.
Left-pane of the Cluster Details Page
The left pane of the cluster’s tracking details page lists:
- Overview, which is described above.
- Cluster Instances. Tracking Cluster Instances provides more information.
- Settings. Tracking the History of Changes in Cluster Settings provides more information.
- Node Bootstrap. Editing or Viewing the Cluster Node Bootstrap provides more information.
- Usage. Tracking the Cluster Usage provides more information.
Tracking Cluster Instances
A Cluster Instance is defined as the instance of a cluster from the time it is started to the time it is terminated. In the left pane, click Cluster Instances to see more details on that cluster’s instances. Here is an example of the Cluster Instances tab.
Click an instance from the list of instances listed in a reverse chronological order to see more details in a specific cluster instance.
Cluster Instance UI Options
The UI of each cluster instance contains these options:
Filter icon: It helps you to filter the cluster instance by using the instance ID, date on which it started, and the cluster status.
Activity tab: It displays a list of events that have occurred during a specific cluster instance.
Nodes tab: It displays the active and inactive nodes.
Logs tab: It contains the cluster start, node bootstrap (coordinator and worker nodes), cluster termination logs, and autoscaling logs. Cluster termination logs are also visible when the cluster is in its terminating state.
Usage tab: It provides details of the QCUH Consumption and the enhanced Node vs Time (Autoscaling Chart) at the specific cluster instance level. Here is an example of the Time versus Node chart.
Tracking the History of Changes in Cluster Settings
In the left pane, click Settings to see the snapshot-view of the edits done on the cluster. Each view displays the configuration edits that are updated in a specific time. Here is an example of snapshots of the cluster settings’ update.
Click a snapshot from the list of edits listed in a reverse chronological order to see the configuration sub options that are modified in a specific time. With this, you can determine the following:
- Governance: With the settings’ history, you can also determine at any given point, the configuration that a cluster had with which a particular instance ran (historical).
- Lineage: You can track the lineage of cluster configurations and understand how it evolved over a period of time.
- Impact of tuning: You can track the lineage and compare it with the QCUH or Node versus Time chart at each instance level to understand the impact of the cluster configuration tuning.
- Debugging: You can determine the configuration or the changes at a given point of time that might have caused some errors in the cluster. This information is valuable in debugging the cluster and eliminating any suspective root cause.
Editing or Viewing the Cluster Node Bootstrap
In the left pane, click Node Bootstrap to see the node bootstrap scripts. It displays the file path and the bootstrap scripts. You can modify the node bootstrap script. Click Save after modifying the node bootstrap script. However, the edits are only effective when the cluster is restarted.
Tracking the Cluster Usage
In the left pane, click Usage to see the QCUH consumption of the cluster. It shows the monthly and daily break up of the QCUH consumption of that cluster. Here is an example.
A detailed report of the QCUH consumption at the overall cluster level (as well as the cluster instance level) are available for:
- Monthly QCUH consumption
- Daily QCUH consumption
- Comparative QCUH of Spot versus On-Demand node types
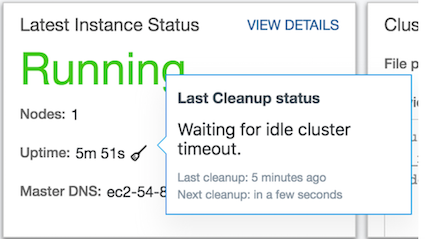
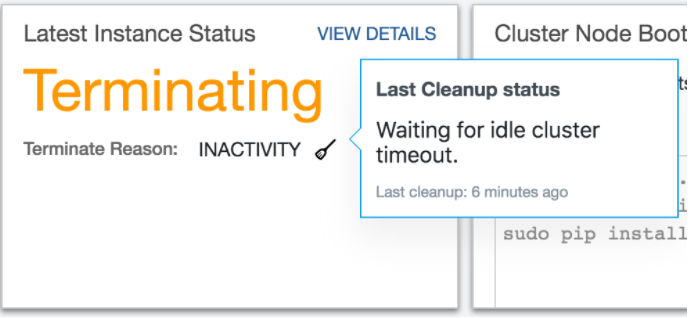
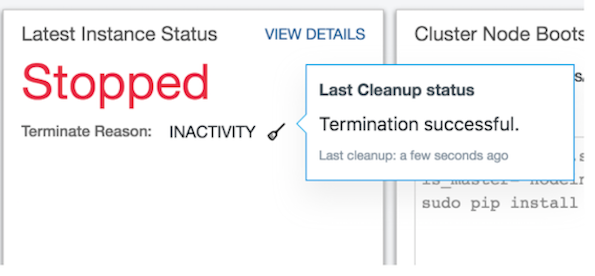
Viewing the Cluster Cleanup Status
You can view the last cluster’s last cleanup status in a specific cluster’s Last Instance Status. A small icon is displayed against the cluster’s status. Click that icon to see the cluster’s status.
The following figures illustrates the cluster’s last cleanup when the cluster was running, terminating, and stopped.
|
|
|
To get the last cluster’s cleanup information through API, see through Cluster API v1.3 and through Cluster API v2.