Monitoring an Airflow Cluster
You can monitor an Airflow cluster by using the Airflow Web Server and Celery Web Server. The web server URLs are available in the Resources column of a running Airflow cluster.
Qubole supports monit within an Airflow cluster to monitor and automatically start the Webserver, Rabbitmq, and Celery services in case of a failure.
Monitoring through Airflow Web Server
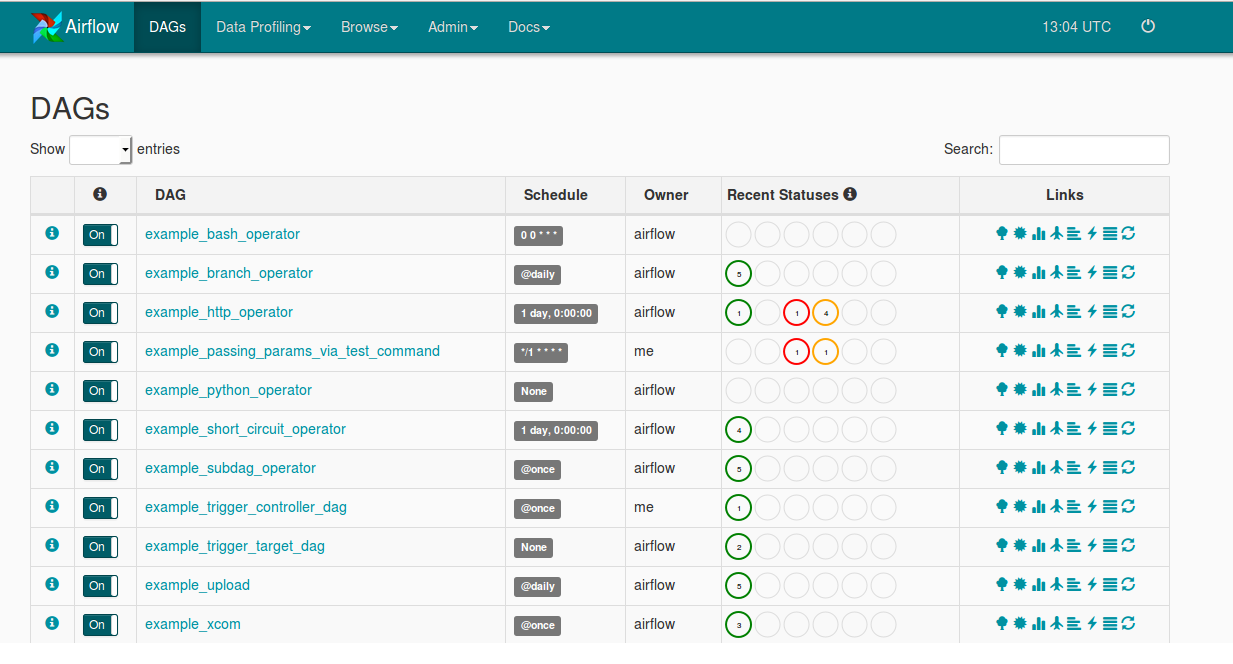
In the Clusters tab, from the cluster Resources of a running Airflow cluster, click Airflow Web Server. The Airflow Web Server is displayed as shown in the following illustration.
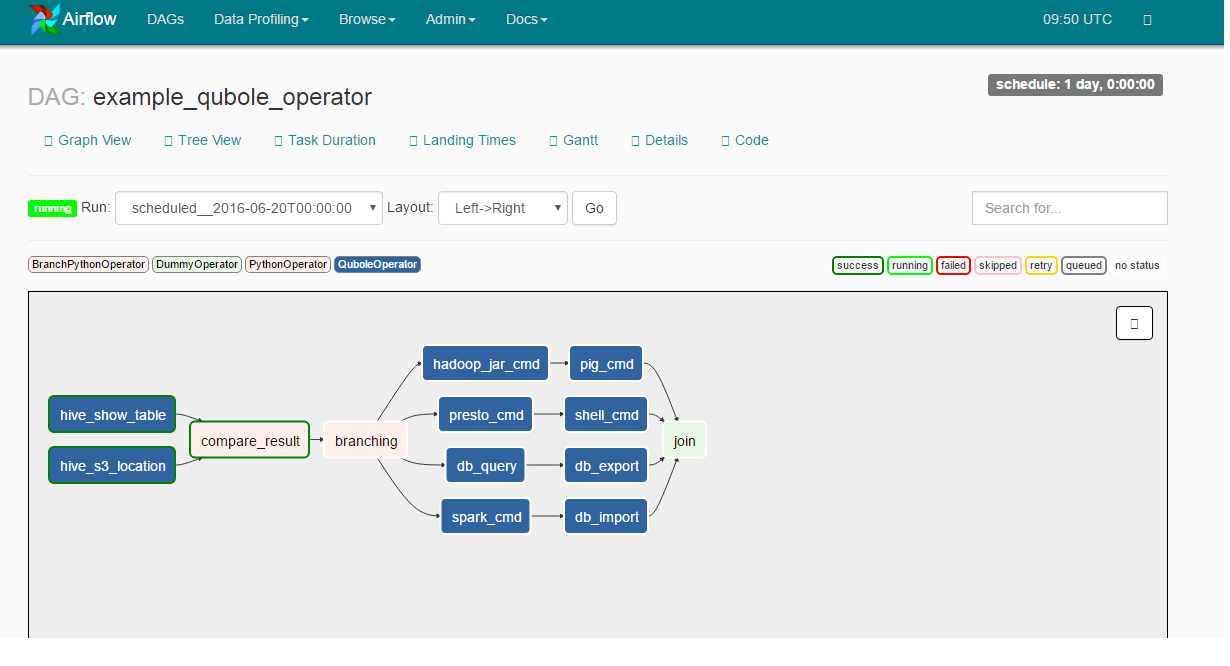
Click the Qubole Operator DAG as shown in the following figure.
Click a command from the chart and you can see the link, Goto QDS as shown in the following figure.
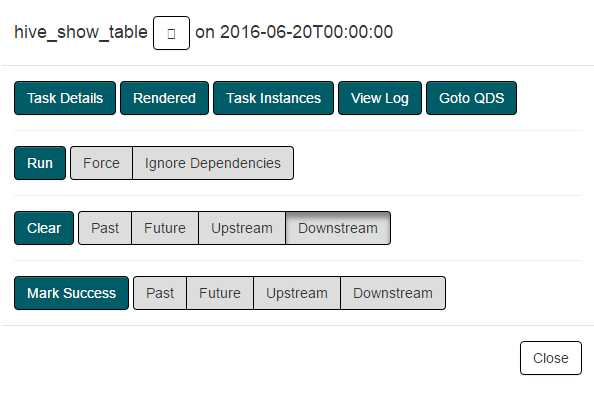
Qubole Operator tasks are linked with a QDS command. Following features are available to facilitate linking:
- Goto QDS: An external link pointing to corresponding to QDS command while visualizing Qubole Operator tasks of a DAG run in the web server.
- Filtering Airflow QDS Commands: Any QDS command triggered through the Airflow cluster contains three tags:
dag_id,task_id,run_id. These can be used to filter QDS commands triggered from Airflow at various levels (dag/task/particular execution).
Monitoring through the Celery Dashboard
In the Clusters tab, from the cluster Resources of a running Airflow cluster, click Celery Dashboard to monitor the Celery workers. The Celery server runs on the 5555 port.
Monitoring through Ganglia Metrics
When Ganglia Metrics is enabled, you can see the Ganglia Metrics URL from the cluster Resources of a running Airflow cluster. The dashboard shows system metrics such as CPU and disk usage.
Monitoring through Logs
You can monitor an Airflow cluster using the following types of logs:
- Airflow logs: Airflow DAG logs are now moved to
/media/ephemeral0/logs/airflow/dags, and a symlink is created to the old location, which is$AIRFLOW_HOME/logs. As a result, the local disk space is not consumed by the logs. - Airflow services logs: Logs for services such as scheduler, webserver, Celery, and so on are under /media/ephemeral0/logs/airflow.
- Airflow logs (remote): All Airflow logs are uploaded to the remote storage location provided in the account. These logs can be found
at
<default location>/airflow/<cluster-id>/dag_logs/and<default location>/airflow/<cluster-id>/process_logs/<cluster_inst_id>/.
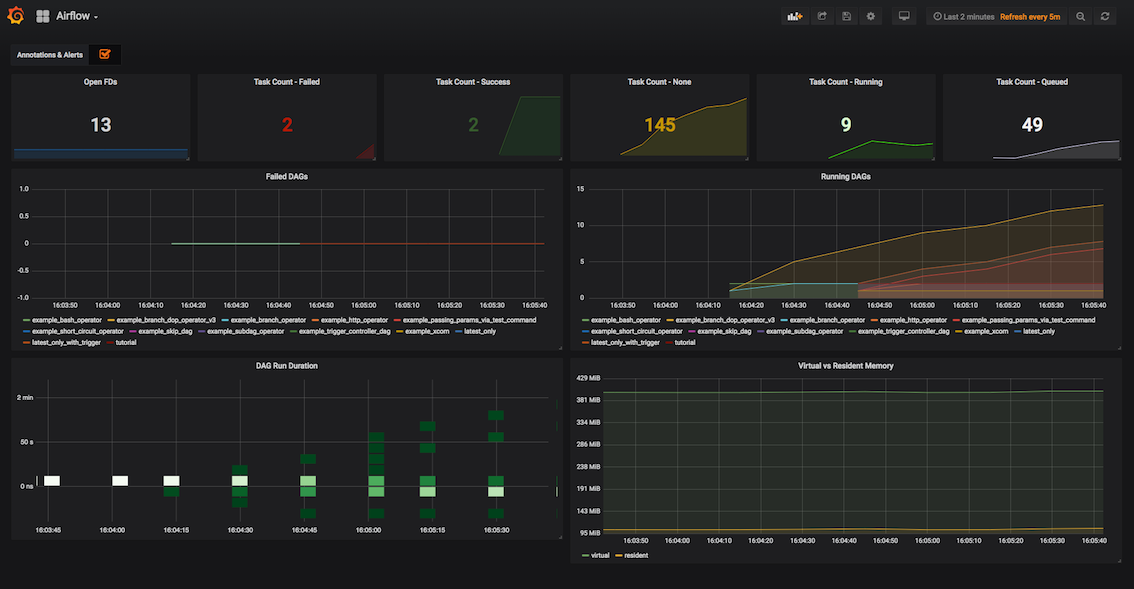
Monitoring through Prometheus
You can monitor an Airflow cluster through Prometheus and Grafana based monitoring which comes pre-installed with the cluster. To enable it for your clusters, please contact Qubole Support. For more information, see https://grafana.com/grafana.
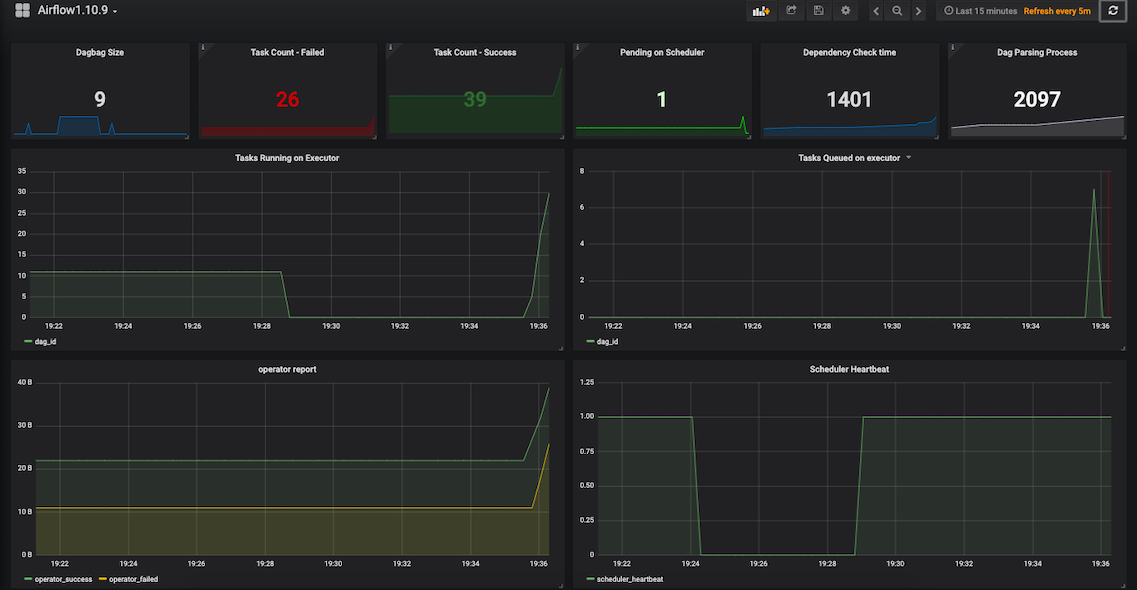
For Airflow version 1.10.9, there is a different dashboard named Airflow1.10.9.
Airflow Clusters also expose the endpoint which can be consumed by any Prometheus Instance to scrape metrics. To access
the endpoint, hit https://<env>.qubole.com/airflow-webserver-<cluster-id>/admin/metrics/ with the Qubole Auth Token
added to the headers. To know more, see Using Custom Headers with Prometheus.
Monitoring through Monit Dashboard
With the help of Monit dashboard, you can view the list of processes running on an Airflow cluster. Apart from viewing the following information such as Status, UP Time, CPU Total, Memory Total, and so on, you can perform various activities such as starting, restarting, stopping the services, and disable the monitoring through the Monit dashboard.
To monitor through Monit dashboard, follow the instructions:
- After logging in to the QDS, click Clusters and the Clusters page appears.
- From the Resources drop-down list of any of the up and running clusters, select Monit Dashboard.
Enter Airflow in the Username field and the cluster id in the Password field. Click Sign In. Monit Service Manager page appears.
On the Monit Service Manager page, you can view a list of systems and processes running on that Airflow cluster with other details such as status, up time, CPU occupancy, memory, and so on. Click the process and the the Process status page appears. On the Process status page, you can view all the necessary details about that process.
Note
You can start, stop, restart the service, and disable monitoring through the Monit Dashboard by using Start service, Stop service, Restart Service, and Disable monitoring buttons respectively. To Start service, Stop service, Restart Service, and Disable monitoring buttons respectively. To start, stop, restart the services and disable monitoring, you must have atleast update permission on the cluster. To know more about the cluster object permission that you require, see Managing Access Permissions and Roles and Managing Cluster Permissions through the UI.
Monitoring through RabbitMQ Dashboard
You can monitor an Airflow cluster through the RabbitMQ dashboard. To use RabbitMQ dashboard, run the following shell command on the Analyze page to create a new user.
sudo /usr/sbin/rabbitmqctl add_user new_user new_password;
sudo /usr/sbin/rabbitmqctl set_user_tags new_user administrator;
sudo /usr/sbin/rabbitmqctl set_permissions -p / new_user ".*" ".*" ".*"
After you create the username and password, you can log in to RabbitMQ dashboard with the newly created credentials (username and password) on the login page.