Network Visualization
Zeppelin 0.8 supports network type visualization, which displays the output as a graph. Network graph has nodes and edges.
The new network visualization is based on JSON with the following parameters:
- nodes (mandatory): list of nodes of the graph. Every node can have the following parameters:
- id (mandatory): the unique id of the node.
- label: the main Label of the node.
- labels: the list of the labels of the node.
- data: the data attached to the node.
- edges: list of edges of the graph.
- id (mandatory): the unique id of the edge.
- source (mandatory): id of source node of the edge.
- target (mandatory): id of target node of the edge.
- label: the main type of the edge.
- data: the data attached to the edge.
- labels: a map (K, V) where K is the node label and V is the color of the node.
- directed: (true/false, default false) which specifies if the graph is a directed graph.
- types: a distinct list of the edge types.
Click on a node or edge on the bottom of the paragraph to find a list of entity properties.
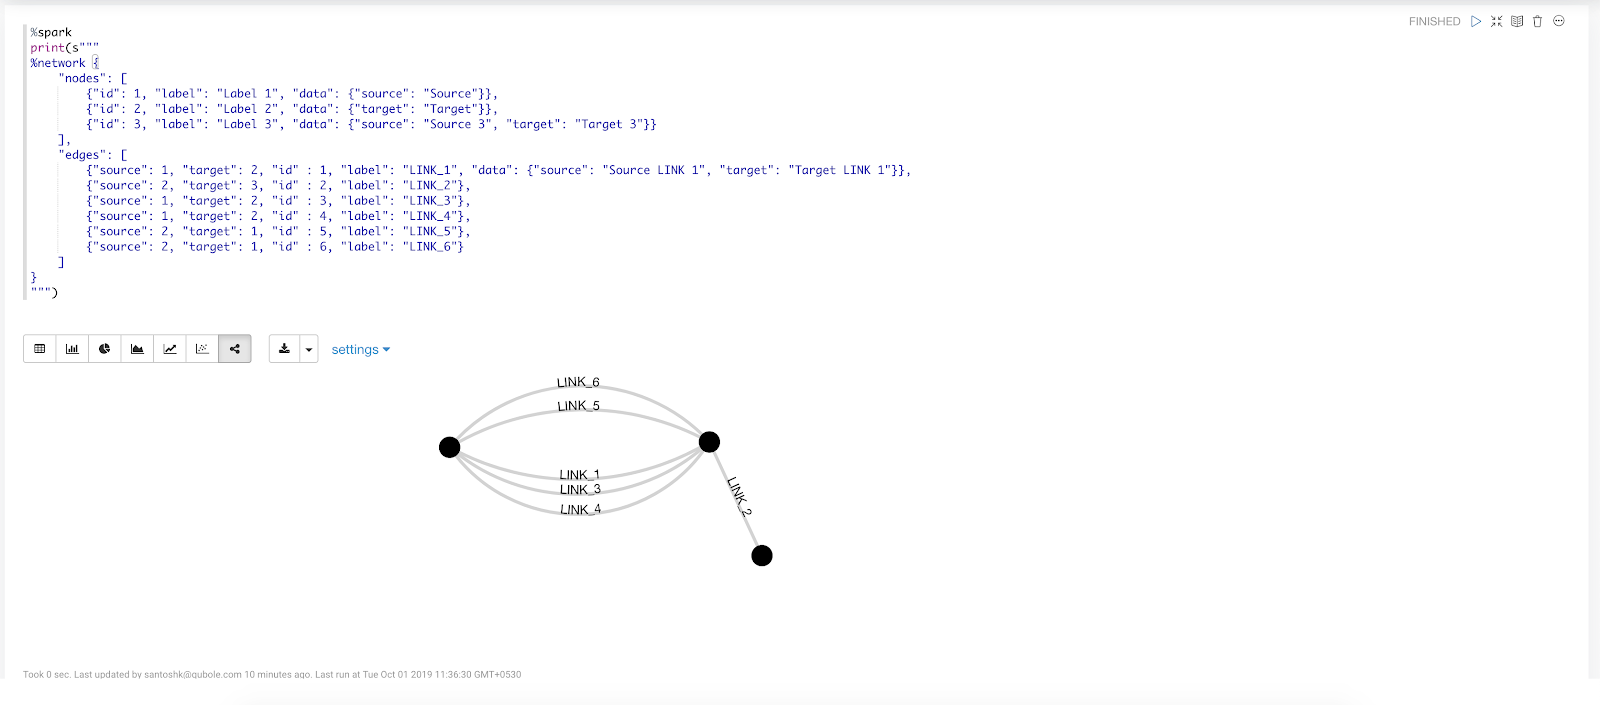
The following example shows a simple graph.
%spark
 print(s"""
 %network {
     "nodes": [
         {"id": 1},
         {"id": 2},
         {"id": 3}
     ],
     "edges": [
         {"source": 1, "target": 2, "id" : 1},
         {"source": 2, "target": 3, "id" : 2},
         {"source": 1, "target": 2, "id" : 3},
         {"source": 1, "target": 2, "id" : 4},
         {"source": 2, "target": 1, "id" : 5},
         {"source": 2, "target": 1, "id" : 6}
     ]
 }
 """)
The corresponding graph is as follows.