Composing a Presto Query
Note
Presto is not currently supported on all Cloud platforms; see QDS Components: Supported Versions and Cloud Platforms.
You can compose a Presto query using the query composer available in the Analyze page.
See Presto for more information about using Presto on QDS.
Note
Presto queries run on Presto clusters. See Mapping of Cluster and Command Types for more information. Presto supports querying tables backed by the storage handlers.
QDS uses the Presto Ruby client, which provides better overall performance, processing DDL queries much faster and quickly reporting errors that a Presto cluster generates. For more information, see the Presto Ruby Client in QDS blog.
Perform the following steps to compose a Presto query:
Caution
Run only Hive DDL commands on a Presto cluster. Running Hive DML commands on a Presto cluster is not supported.
Note
Using the Supported Keyboard Shortcuts in Analyze describes the supported keyboard shortcuts.
Navigate to the Analyze page and click Create. Select Presto Query from the Command Type drop-down list.
Query Statement is selected by default from the drop-down list. Enter the Presto query in the text field.
-or-
If you want to run a query through a path, select Query Path from the drop-down list, then specify the cloud storage path that contains the Presto query file.
Note
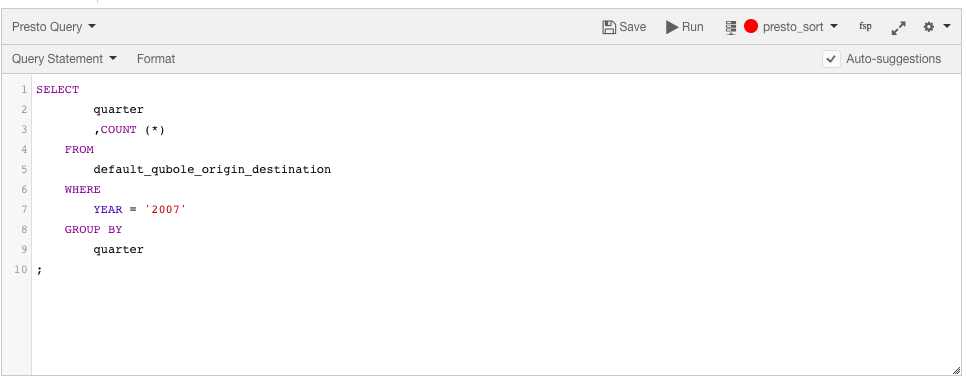
You can add a session property to queries that run on a Presto-0.208-and-later cluster,
qubole_max_raw_input_datasize=1TBto limit the total bytes scanned. Queries that exceed this limit fail with theRAW_INPUT_DATASIZE_READ_LIMIT_EXCEEDEDexception. This ensures rogue queries do not run for a very long time.A sample Presto query in the composer is shown in the following figure.
Click Run to execute the query. Click Save if you want to run the same query later. (See Workspace for more information on saving queries.)
The query result is displayed in the Results tab and the query logs in the Logs tab. The Logs tab has the Errors and Warnings filter. For more information on how to download command results and logs, see Downloading Results and Logs.
Note
For a given Presto query, a new Presto Query Tracker is displayed in the Logs tab when:
- A cluster instance that ran the query is still up.
- The query info is still present in the Presto server in that cluster instance. The query information is periodically purged from the server.
If any of the above 2 conditions is not met, the older Presto Query Tracker is displayed in the Logs tab.
For REST API-related information, see Submit a Presto Command.