Dashboards
You must be a owner of a QDS account or a user with Create permission to publish a dashboard.
Note
Ensure that you have permissions to the Folder resource as described in Resources, Actions, and What they Mean.
Proceed as follows:
From the main menu of the QDS UI, navigate to Notebooks.
Click on a notebook to open it.
Click the Dashboards icon near the top right of the screen and you can see Create Dashboard as shown here.

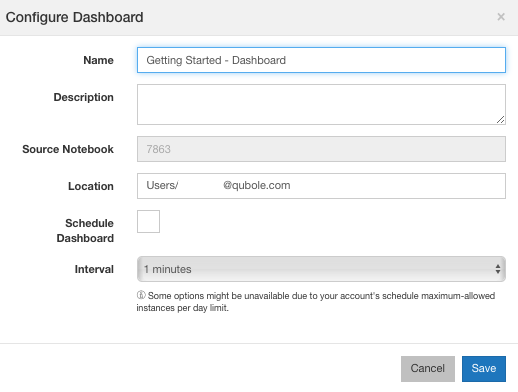
Click Create Dashboard or the + sign and the resulting screen is a dialog as shown here.

Provide a name for the dashboard and choose a location from the dropdown (browse to any of the location using the location picker). The location can be:
My Home (your own folder)
Users (choose a user from the dropdown)
Common
Note
To create a dashboard in a folder other than My Home, you must have write permission to that folder.
Optionally add a description.
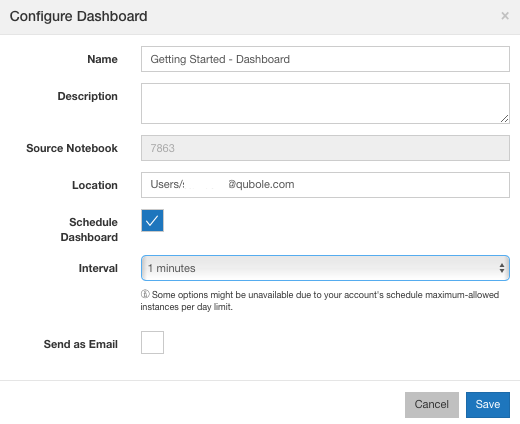
Select Refresh Periodically if you want to refresh the dashboards at regular intervals. The Interval field gets enabled once you select Refresh Periodically as shown here.

The default time interval displayed is based on the Maximum Instances per day set for a specific account in the account’s limits. To change it, select any value from the Interval drop-down list.
The new dashboard appears on the right panel of the screen as shown here.

You can just click the dashboard or navigate to Dashboards to see the dashboard that you have published as shown here.

Understanding the Different Dashboard Modes
By default the dashboard is in a Read-only (compute is DOWN) or in an Editing (compute is UP) mode.
The associated notebook owner can see the dashboard in the Editing mode if the compute is UP. Pull down the Editing mode drop-down list and you can see Enable Interactive Mode which enables you to go into personalized view. The Interactive Mode lets you create a personalized view where you (or any user) can change the paragraph parameters (if any) and see a different result than the actual dashboard.
You (or any user) must have an Execute permission to enter into the Interactive Mode.