Monitoring and Alerts
When you run the streaming pipelines, you can monitor the real-time dashboard of the pipelines. You can also check the events, instances and logs for debugging in case of any errors.
If you have set the alerts when building pipelines, you receive alerts through the selected channels when the pipeline fails.
Monitoring from the Grafana Dashboard
When a pipeline is running, to view the real-time dashboard of a pipeline, perform the following steps:
- Click Monitor on the top right corner. The Grafana Dashboard is displayed as a separate tab.
- Click Structured Streaming Dashboard. It shows the visual representation of the real-time status of the pipeline in terms of latency, processing rate, state store bytes, and state store rows.
The following animated GIF shows the Grafana dashboard.

Viewing the Events and Logs
For debugging any issue or error, you can view the events and logs of the pipeline from the State-of-the-Union view.
The Events pane displays the live time series view. It displays the information such as the number of records that are processed at a particular timeline.
The Instances & Logs pane displays the command id for each instance, the corresponding state, start and end time, and link to the logs. For an instance, click on the corresponding Logs link to download the logs.
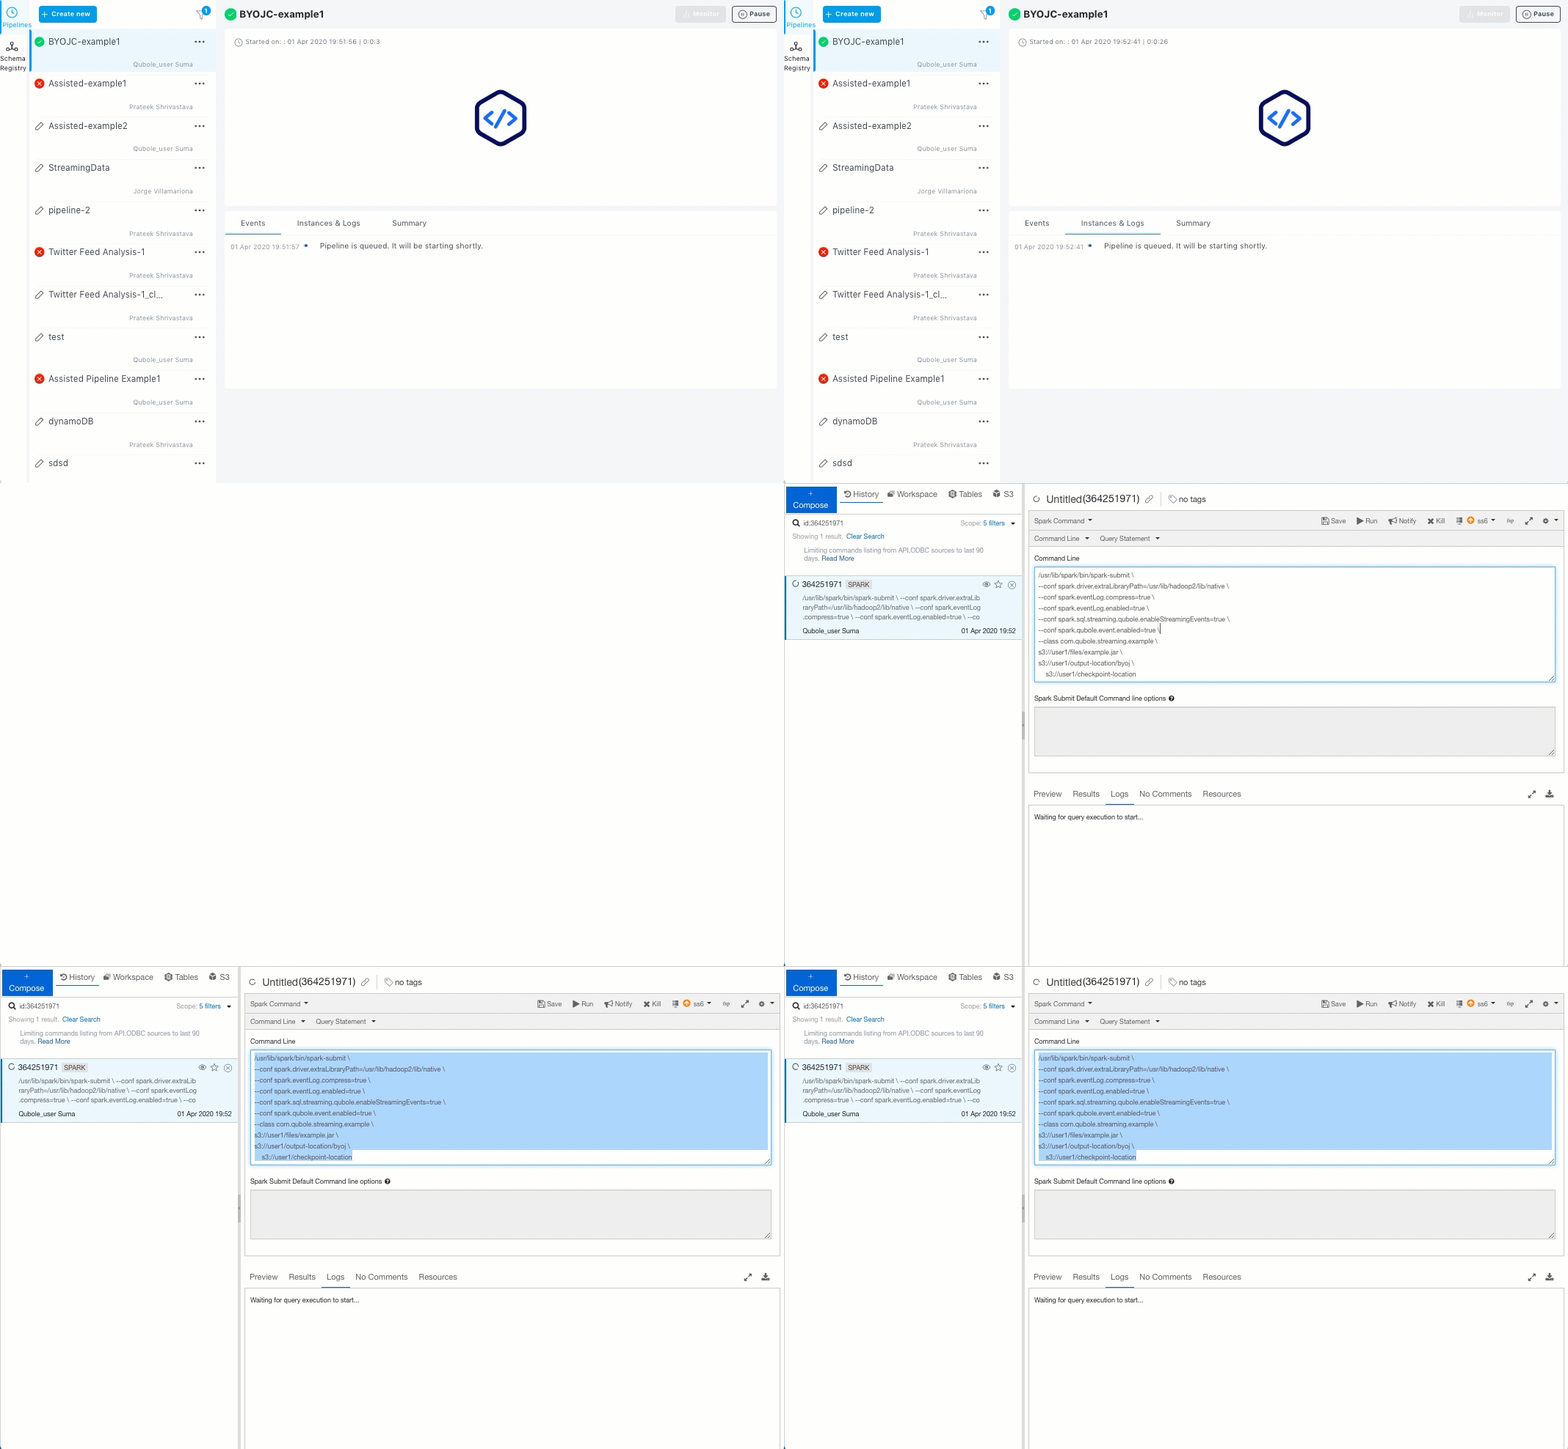
To view the logs on the Analyze page, click on the required Command ID. The Analyze page opens in a separate tab. The Analyze page displays the entire code of the pipeline. You can edit the code and re-run it as an independent command.
The following animated GIF shows the Events pane and viewing an instance in the Analyze page.
