Viewing RubiX Metrics for Qubole Clusters
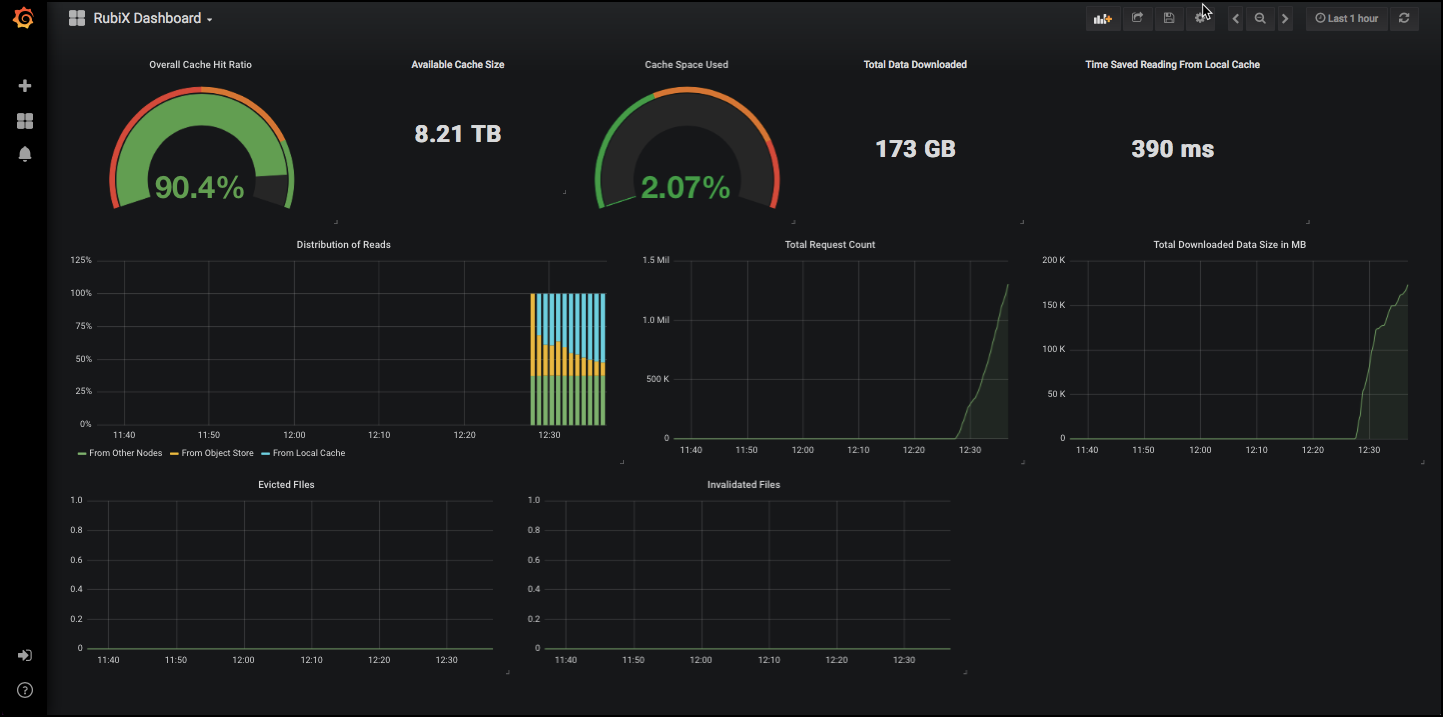
You can monitor the Rubix metrics for the supported Qubole clusters from the Grafana Dashboard.
Note
RubiX dashboard is not enabled for all users by default. Create a ticket with Qubole Support to enable this feature on the QDS account.
Steps
Navigate to the Clusters page.
Select the required cluster.
Navigate to Overview >> Resources, and select Prometheus Metrics. The Grafana dashboard opens in a separate tab.
Click on Home on the top left corner, and select RubiX Dashboard.
The following figure shows a sample RubiX Dashboard with the details.
