Presto Query Issues
This topic describes common Presto query issues with solutions and they are:
Handling Memory Issues
When you hit memory issues in Presto queries, as a workaround, perform the following steps:
Use a bigger cluster by increasing the maximum worker node count.
Add a limit clause for all subqueries.
Use a larger cluster instance.
Presto Configuration Properties describes the query execution configuration properties along other settings.
Common Issues and Potential Solutions
Here are some common issues in Presto with potential solutions.
Query exceeded max memory size of <XXXX> GB
This issue appears when memory limit gets exhausted at the cluster level. Set higher value of query.max-memory. This
is a cluster-level limit, which denotes maximum memory that a query can take aggregated across all nodes.
Query exceeded local memory limit of <XXXX> GB
Increase the value of query.max-memory-per-node equal to 40% of worker instance Memory. The query.max-memory-per-node
determines maximum memory that a query can take up on a node
Here are recommendations to avoid memory issues:
If larger table is on the right side, the chances are that Presto errors out. So, an ideal scenario is put smaller table on the right side and bigger tables on the left side of JOIN.
The other alternative is use distributed JOINs. By default, Presto supports Map-side JOINs but you can also enable Reduce-side JOINs (distributed JOINs). Rework the query to bring down the memory usage.
No nodes available to run the query
When the coordinator node cannot find node to run the query, one of the common reasons is that cluster is not configured properly. It could be a generic error which might need further triage to find the root cause. Such error message is also seen when no data source attached for the connector.
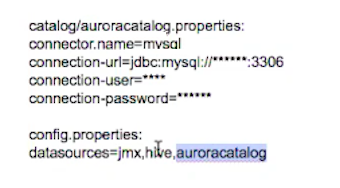
Ensure that the connector data source configuration is correct and catalogue properties is defined as below.

This might also happen due to a configuration error in which worker daemons did not come up or nodes died due to out-of-memory
error. Check server.log in worker nodes.
This can also be seen when the coordinator node is small and it could not do the heartbeat collection.
Presto Queries Failing Sporadically with java.net.SocketTimeoutException
Presto queries failed with the following java.net.SocketTimeoutException when a custom Hive metastore (HMS) (with good
connectivity) is used.
2019-06-20T16:01:40.570Z    ERROR    transaction-finishing-12    com.facebook.presto.transaction.TransactionManager    Connector threw exception on abort
com.facebook.presto.spi.PrestoException: 172.18.40.110: java.net.SocketTimeoutException: Read timed out
at com.facebook.presto.hive.metastore.ThriftHiveMetastore.getTable(ThriftHiveMetastore.java:214)
at com.facebook.presto.hive.metastore.BridgingHiveMetastore.getTable(BridgingHiveMetastore.java:74)
at com.facebook.presto.hive.metastore.CachingHiveMetastore.loadTable(CachingHiveMetastore.java:362)
at com.facebook.presto.hive.metastore.CachingHiveMetastore.access$500(CachingHiveMetastore.java:64)
at com.facebook.presto.hive.metastore.CachingHiveMetastore$6.load(CachingHiveMetastore.java:210)
at com.facebook.presto.hive.metastore.CachingHiveMetastore$6.load(CachingHiveMetastore.java:205)
at com.google.common.cache.CacheLoader$1.load(CacheLoader.java:182)
at com.google.common.cache.LocalCache$LoadingValueReference.loadFuture(LocalCache.java:3716)
at com.google.common.cache.LocalCache$Segment.loadSync(LocalCache.java:2424)
at com.google.common.cache.LocalCache$Segment.lockedGetOrLoad(LocalCache.java:2298)
at com.google.common.cache.LocalCache$Segment.get(LocalCache.java:2211)
at com.google.common.cache.LocalCache.get(LocalCache.java:4154)
at com.google.common.cache.LocalCache.getOrLoad(LocalCache.java:4158)
at com.google.common.cache.LocalCache$LocalLoadingCache.get(LocalCache.java:5147)
at com.facebook.presto.hive.metastore.qubole.QuboleLoadingCache.get(QuboleLoadingCache.java:57)
at com.facebook.presto.hive.metastore.CachingHiveMetastore.get(CachingHiveMetastore.java:312)
at com.facebook.presto.hive.metastore.CachingHiveMetastore.getTable(CachingHiveMetastore.java:356)
at com.facebook.presto.hive.metastore.CachingHiveMetastore.loadTable(CachingHiveMetastore.java:362)
at com.facebook.presto.hive.metastore.CachingHiveMetastore.access$500(CachingHiveMetastore.java:64)
at com.facebook.presto.hive.metastore.CachingHiveMetastore$6.load(CachingHiveMetastore.java:210)
at com.facebook.presto.hive.metastore.CachingHiveMetastore$6.load(CachingHiveMetastore.java:205)
at com.google.common.cache.CacheLoader$1.load(CacheLoader.java:182)
at com.google.common.cache.LocalCache$LoadingValueReference.loadFuture(LocalCache.java:3716)
at com.google.common.cache.LocalCache$Segment.loadSync(LocalCache.java:2424)
Solution:
Note
Firstly, you should check why SocketTimeout has occurred in Hive metastore logs. HMS logs are available on
the coordinator node at /media/ephemeral0/logs/hive<version>/hive_ms.log. HMS logs display some relevant errors
and you should take steps according to errors that you see in the logs. Based on errors, increasing
the thrift Heap memory or increasing the socket timeout helps in resolving this issue.
Increase the size of the coordinator node to enhance its memory. (For example, increase the coordinator node’s memory from 30 GB RAM to 60 GB RAM.)
Create a ticket with Qubole Support to increase the metastore’s maximum heap memory at the cluster level. (If you get the metastore’s memory increased at the account-level through Qubole Support, then it applies to all clusters.)
Increase the socket-timeout values of the custom Hive metastore by overriding the default values. Pass them as
catalog/hive.propertiesin the cluster’s Override Presto Configuration that is under Advanced Configuration > PRESTO SETTINGS as shown in this example.catalog/hive.properties: hive.metastore-timeout=3m hive.s3.connect-timeout=3m hive.s3.socket-timeout=3m
For more information on cluster settings, see Managing Clusters.
Tracing the Query Failure caused by Spot Node Loss
Whenever a node encounters Spot loss, the query info of all queries running on that node is updated
with information about the spot node interruption. The query may or may not fail due to the spot interruption. The
affected query’s query info displays the warning: Query may fail due to interruption of spot instance: <Instance ID>
with private IP: <IP> by cloud provider at: <Spot Interruption Time> GMT.
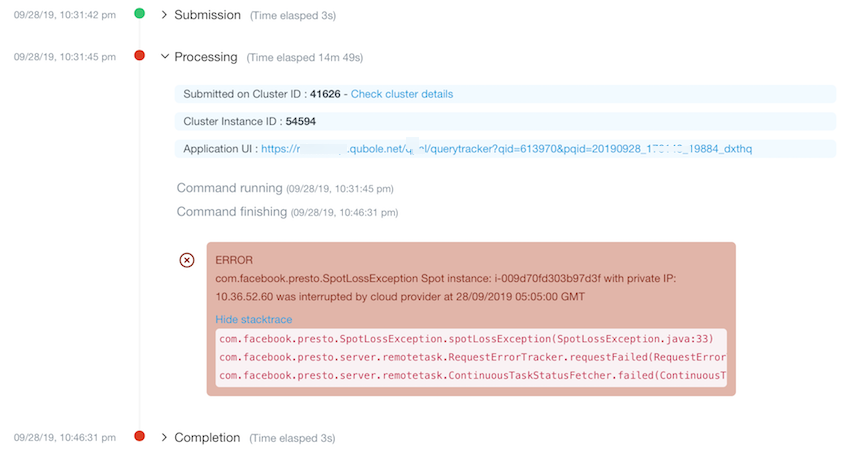
The error about Query that has failed due to a Spot loss is displayed in the exception stack trace. This is an example of the Spot loss error in the stack trace.

Query failures due to Spot node interruptions are detected faster using information about the Spot interruption time from the Cloud Provider.