Spark Metrics on the Default Datadog Dashboard
Qubole Spark supports Datadog monitoring and it also supports metrics on Datadog dashboards.
Note
The feature to use the Datadog UI is not available by default. Create a ticket with Qubole Support to enable this feature on the QDS account.
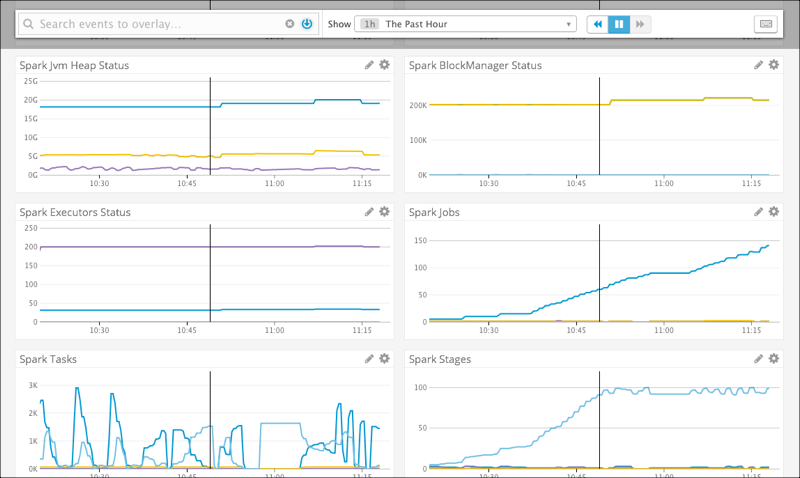
When Datadog monitoring is configured on a Spark cluster, the metrics of an active cluster are displayed on a default Datadog dashboard. The default Datadog dashboard metrics are:
driver.jvm.heap.{max, heap, committed}(Spark JVM Heap Status)driver.BlockManager.memory.*andBlockManager.memory.disk.*(Spark BlockManager Status)driver.ExecutorAllocationManager.executors.*(Spark Executors Status)driver.DAGScheduler.job.*anddriver.ExecutorAllocationManager.executors.*(Spark Jobs)driver.ExecutorAllocationManager.executors.*(Spark Tasks)driver.DAGScheduler.stage.*and driver.ExecutorAllocationManager.executors.*`` (Spark Stages)driver.ExecutorAllocationManager.executors.numSQLRunning.*(Spark number of SQL running)
As a prerequisite, you must enable Datadog monitoring on the Spark cluster.
Enabling Datadog
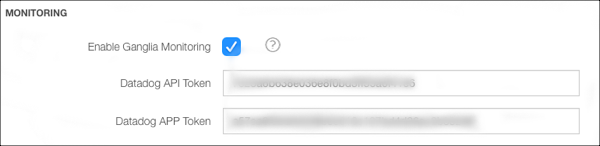
Advanced configuration: Modifying Cluster Monitoring Settings describes how to enable Datadog through the cluster UI. Add Datadog API and APP tokens in the Advanced Configuration of the Spark cluster. Create a New Cluster describes how to configure Datadog through a API call.
Here is an example that illustrates Datadog tokens on the cluster UI.
You can enable Datadog monitoring in Control Panel > Account Settings which would apply the settings on all clusters of that account. For information on enabling Datadog at account level, see Configuring your Access Settings using IAM Keys or Managing Roles.
Viewing the Default Datadog Dashboard
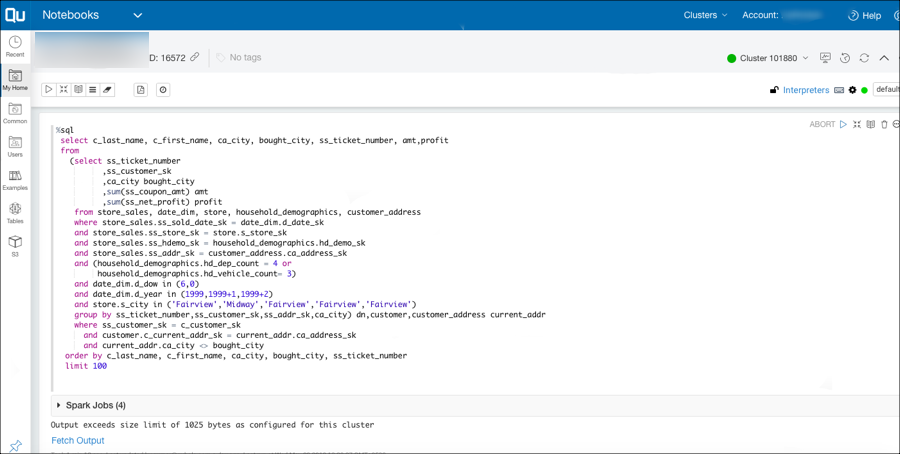
After enabling Datadog on the QDS account/cluster, the Datadog metrics related to Spark are displayed on the Datadog UI. For example, run a Spark query on the QDS UI (or API).
Here is an example of a Spark query run from the Notebooks.
Log in to the Datadog UI and navigate to Dashboards. You can find the Spark dashboards in the list. Here is an illustration of the Datadog dashboards.
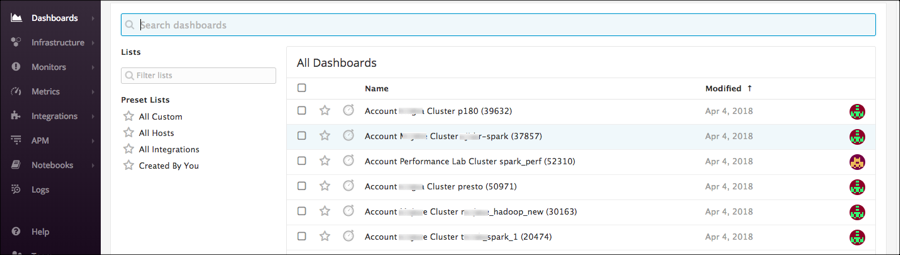
Click the default Datadog which is named with this convention - Account <account owner> Cluster <label> (<cluster ID>).
You can see the default Datadog metrics.
Here is an example of the Spark metrics on the default Datadog dashboard.