Using the Cluster User Interface
Note
Qubole does not currently support all cluster types on all Cloud platforms; see QDS Components: Supported Versions and Cloud Platforms.
Qubole supports options to control the query runtime, which are described in Configuring Query Runtime Settings.
Navigate to the Clusters page in the QDS UI to see the list of active and inactive clusters.
Note
Only an administrator can see all the UI options described in this page. A system user can see most of the UI options except a few that are only accessible to the administrator. The options are managed by the roles and groups configuration.
For more information on cluster configuration through the QDS UI, see Managing Clusters.
The icon next to each cluster ID indicates what type of cluster it is. Here is how the cluster types are indicated by the icon:
A Hadoop 2 (Hive) cluster has an H2 within the round icon. You can enable Hive Server 2 in an Hadoop 2 cluster as described under Configuring a HiveServer2 Cluster.
A Presto cluster has a P within the round icon.
A Spark cluster has an S within the round icon.
An Airflow cluster has an A within the round icon.
Active and inactive clusters are listed as two separate categories on the Clusters page. The active clusters have a green icon and inactive clusters have a pale-red icon.
There is another category, Transitioning Clusters that shows clusters that were just started and are still in a pending state (not fully in the UP state); and also clusters that have just stopped, and are still in the the process of being terminated.
Next to each cluster, there are four buttons:
Resources: Contains the list of resources such as cluster start logs, Spark Job Server (for a Spark cluster), and so on, for a running cluster.
Start: Click this button to start the cluster. For a running cluster, this button is replaced by a Stop button.
Edit: Click this button to edit a cluster’s configuration.
(An elipse): This button has a sub-list of options such as editing the cluster’s node bootstrap script, cloning, deleting, and setting the cluster as the default.
Click an active cluster to see the resources and public and private IP addresses of its coordinator and worker nodes.
The Node Bootstrap Logs are also available on the Clusters page of the QDS UI, as part of Nodes table for a running cluster. On the Clusters page, below a running cluster, the number of nodes in the cluster is displayed next to Nodes. Click the number to see the Nodes table.
Searching and Filtering Clusters
You can use the search box to enter a cluster ID or label to find the closest matching cluster (useful if the list of clusters is too long to be displayed in full).
Click the filter icon on the clusters UI page to filter the cluster by its status or type.
The search box and expanded filter options for clusters are as shown in the following figure.
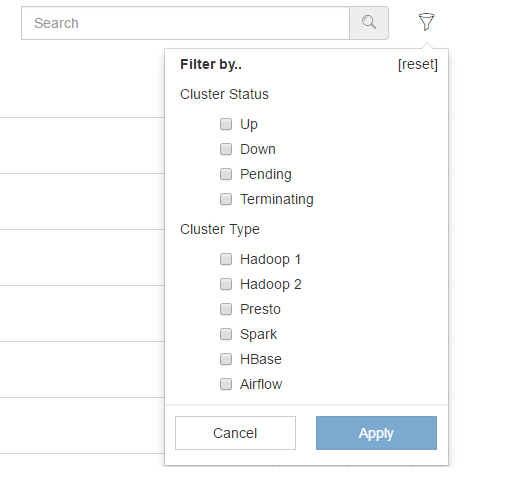
In the filter, select the cluster type or status as required and click Apply.
Understanding the UI of an Active Cluster
Click an active cluster and it provides you the cluster-related information such as:
Cluster ID and the cluster type
The cluster up time
The cluster start time
Number of nodes
Coordinator DNS
All its available resources
Node details such as instance type, role, public and private DNS, Spot Instance, and the uptime of the node.
When you hover the mouse over the coordinator DNS of the cluster, you see a copy button. Click it to copy the cluster’s coordinator DNS. You can also click to view the commands that are run on a specific cluster by clicking the label name in the list of active/inactive clusters.
Note
You can reassign a cluster’s label to another cluster by dragging it and dropping it from one cluster to the other; do this on the Clusters page of the QDS UI. Make sure that the clusters are not running, so as not to interfere with active queries. Reassign a Cluster Label describes how to reassign a cluster label using the API.
Viewing Deleted Clusters
Click View Deleted Clusters, at the bottom of the Clusters page, to see the list of deleted clusters.
Launching a Web Terminal for Clusters on QDS-on-AWS
QDS supports launching a cluster coordinator’s web terminal for a cluster using Qubole on AWS. This feature is available for a beta access.
Create a ticket with Qubole Support to get this
feature enabled on the account. You can launch a cluster coordinator’s web terminal on <AWS environment>/butterfly-terminal-<cluster ID>.
Where <AWS environment> can be any of these QDS-on-AWS environments:
Example: https://api.qubole.com/butterfly-terminal-<clusterID>