Using the Qubole Cost Explorer
Once the tables are created, you can query them through:
Self-Service SQL Analytics using Qubole Hive, Spark and/or Presto
Pre-built Notebooks
The following pre-built notebooks are available from Qubole.
Note
The pre-built notebooks are Spark notebooks and require a Spark cluster to run.
TCO Notebook
This notebook provides Cloud VM (Ec2, in dollars) spend and Spot savings information at both the account level and the individual cluster level.
Incorporating Discounts for Ec2$ Calculation
For specific scenarios, where RIs are used or AWS EDP discounts are applicable, you can incorporate these discounts into the Ec2 (in dollars) calculation through the following input:
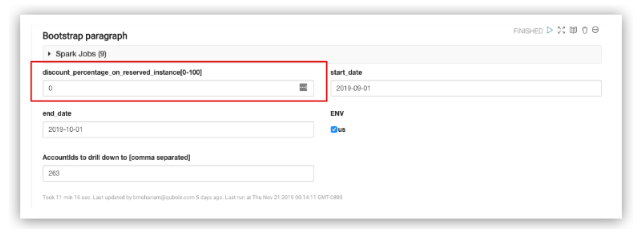
This discount is applied for all On-Demand nodes and the TCO (VM$) is adjusted accordingly.
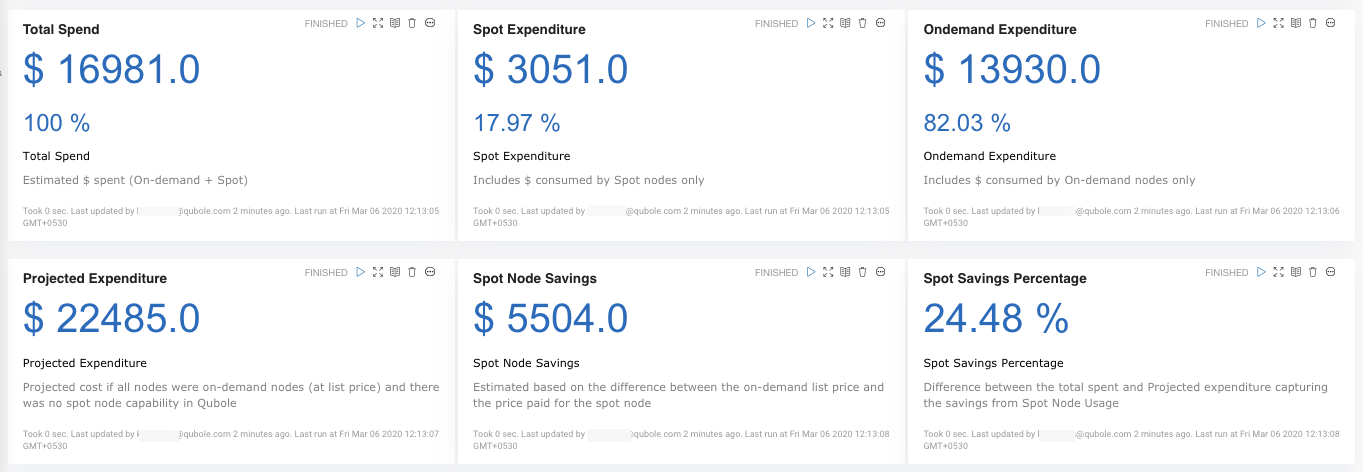
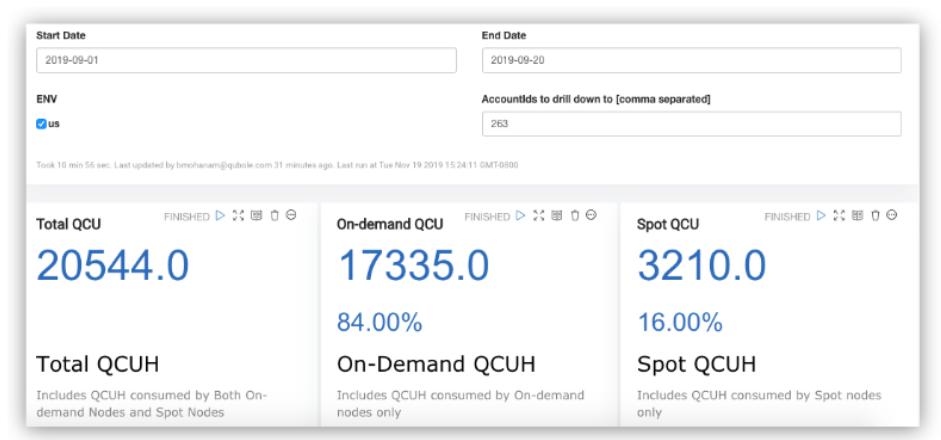
The TCO Dashboard paragraph provides a high-level overview of the Spot and On-Demand Ec2 spend in dollars. It also provides the overall dollar savings due to spot instances.
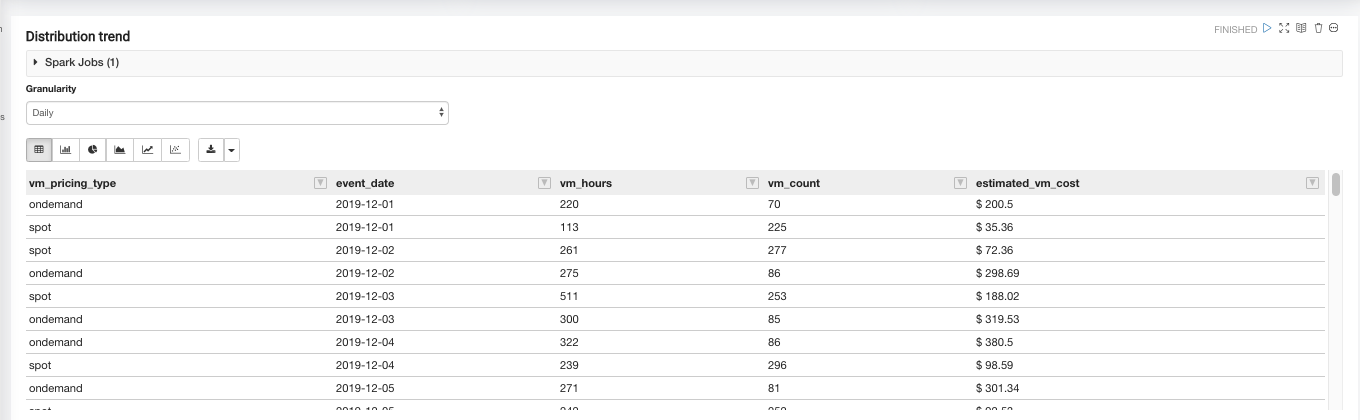
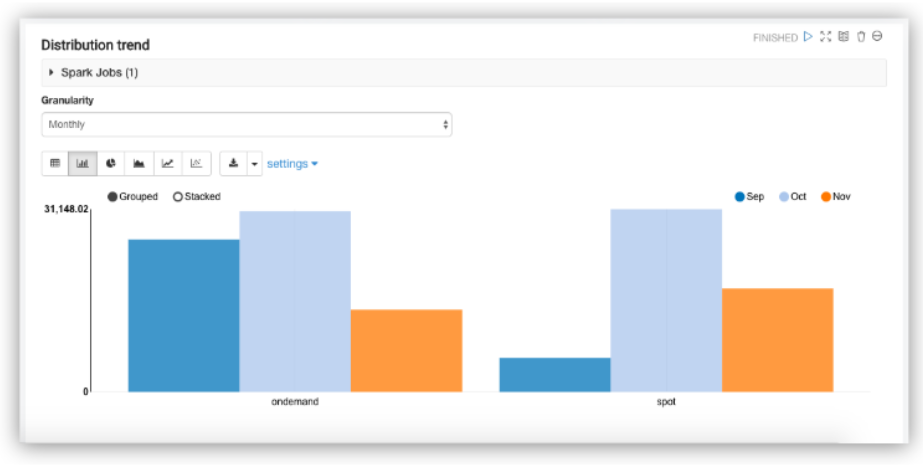
The Distribution trend paragraph provides the monthly Spot vs On-Demand VM dollar (Ec2) spend trend chart based on the chosen time granularity (monthly, weekly, daily).
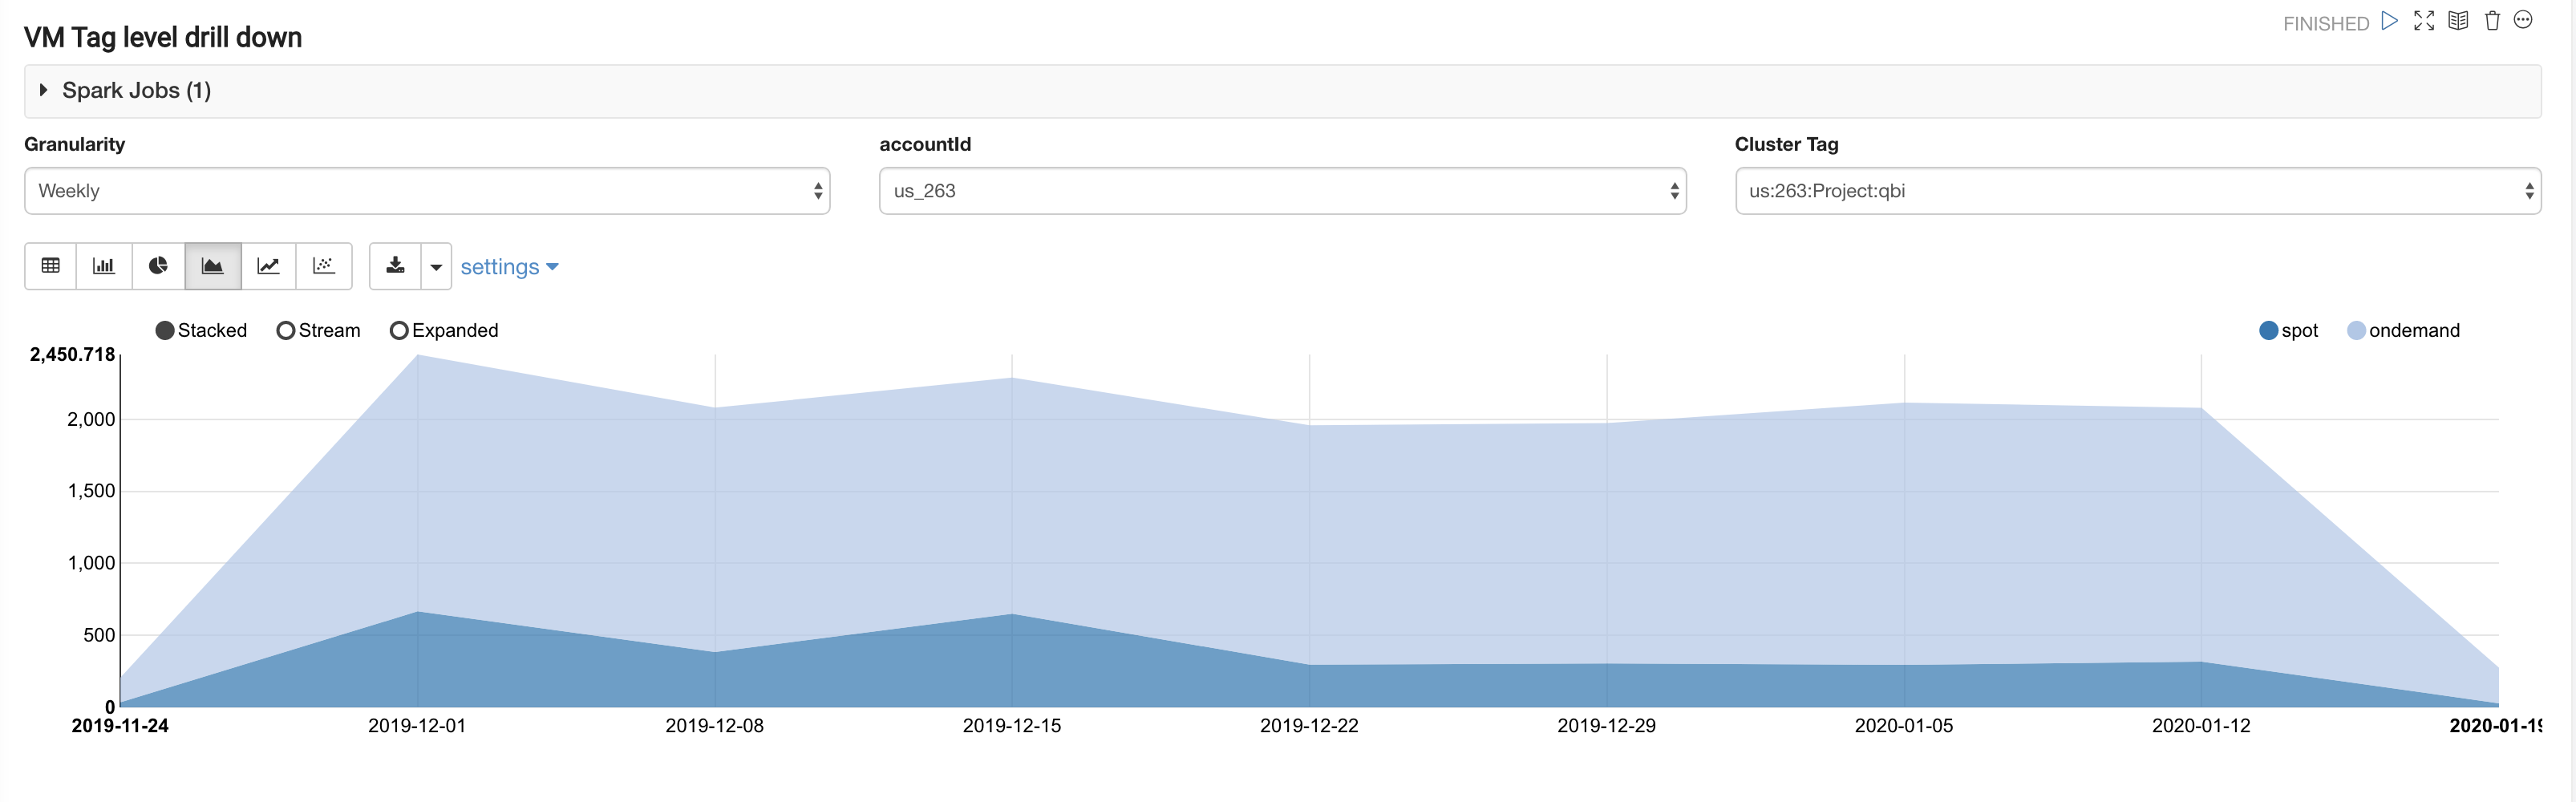
The VM Tag level paragraph provides the Spot vs On-Demand Ec2 spend (in dollars) at the chosen time granularity (monthly, weekly, daily) for a given custom VM tag.
The Qubole Cluster Label level paragraph provides the Spot vs On-Demand Ec2 dollar spend at the chosen time granularity (monthly, weekly, daily) for a given Qubole cluster label.
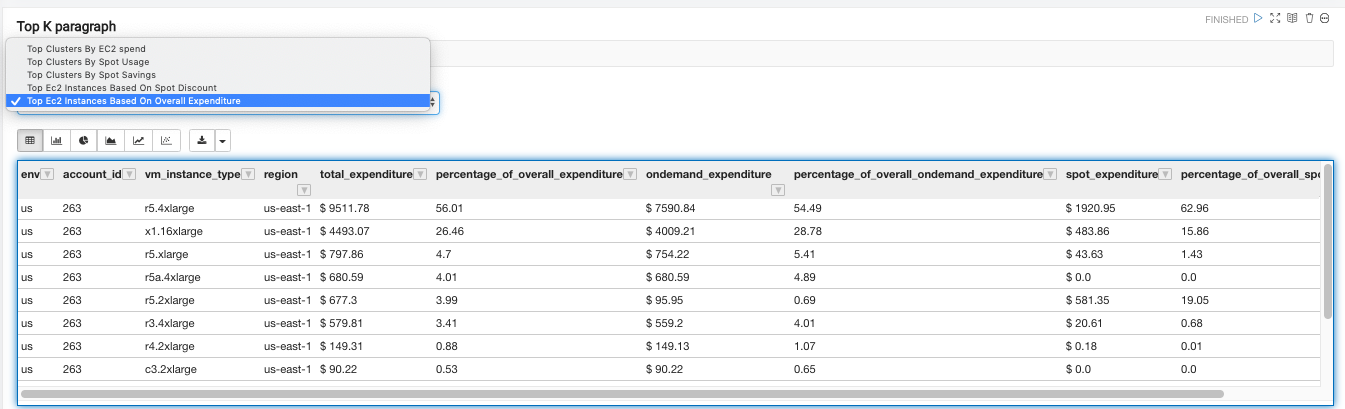
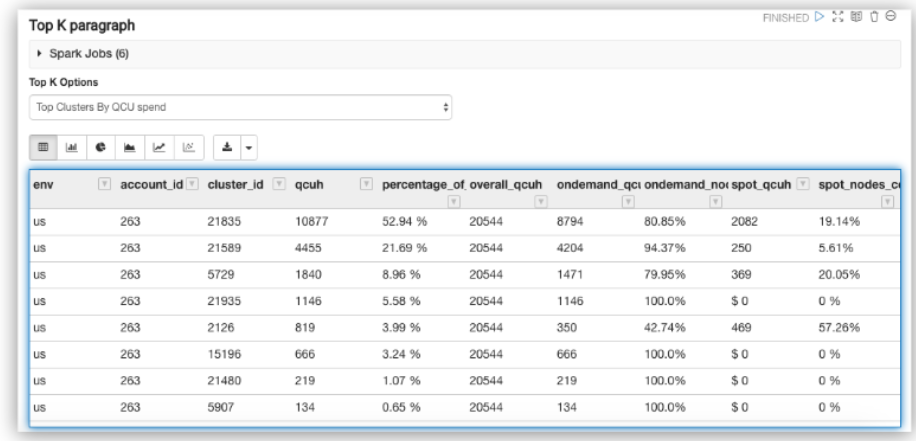
The Top K paragraph ranks the clusters based on the QCU spend across the following dimensions: Ec2 spend (in dollars), Spot usage (based on node hours), Spot savings (dollars saved), Spot discount (% discount on Spot instances as compared to On-Demand instances).
QCU Notebook
This notebook provides Qubole Compute Unit (QCU) spends at the account and the individual cluster levels.
The QCU Dashboard paragraph provides a high-level overview of the overall QCU spend for a given time range. It also provides details on Spot vs On-Demand QCU.
The Distribution trend paragraph provides the monthly Spot vs On-Demand QCU spend trend chart based on the chosen time granularity (monthly, weekly, daily).
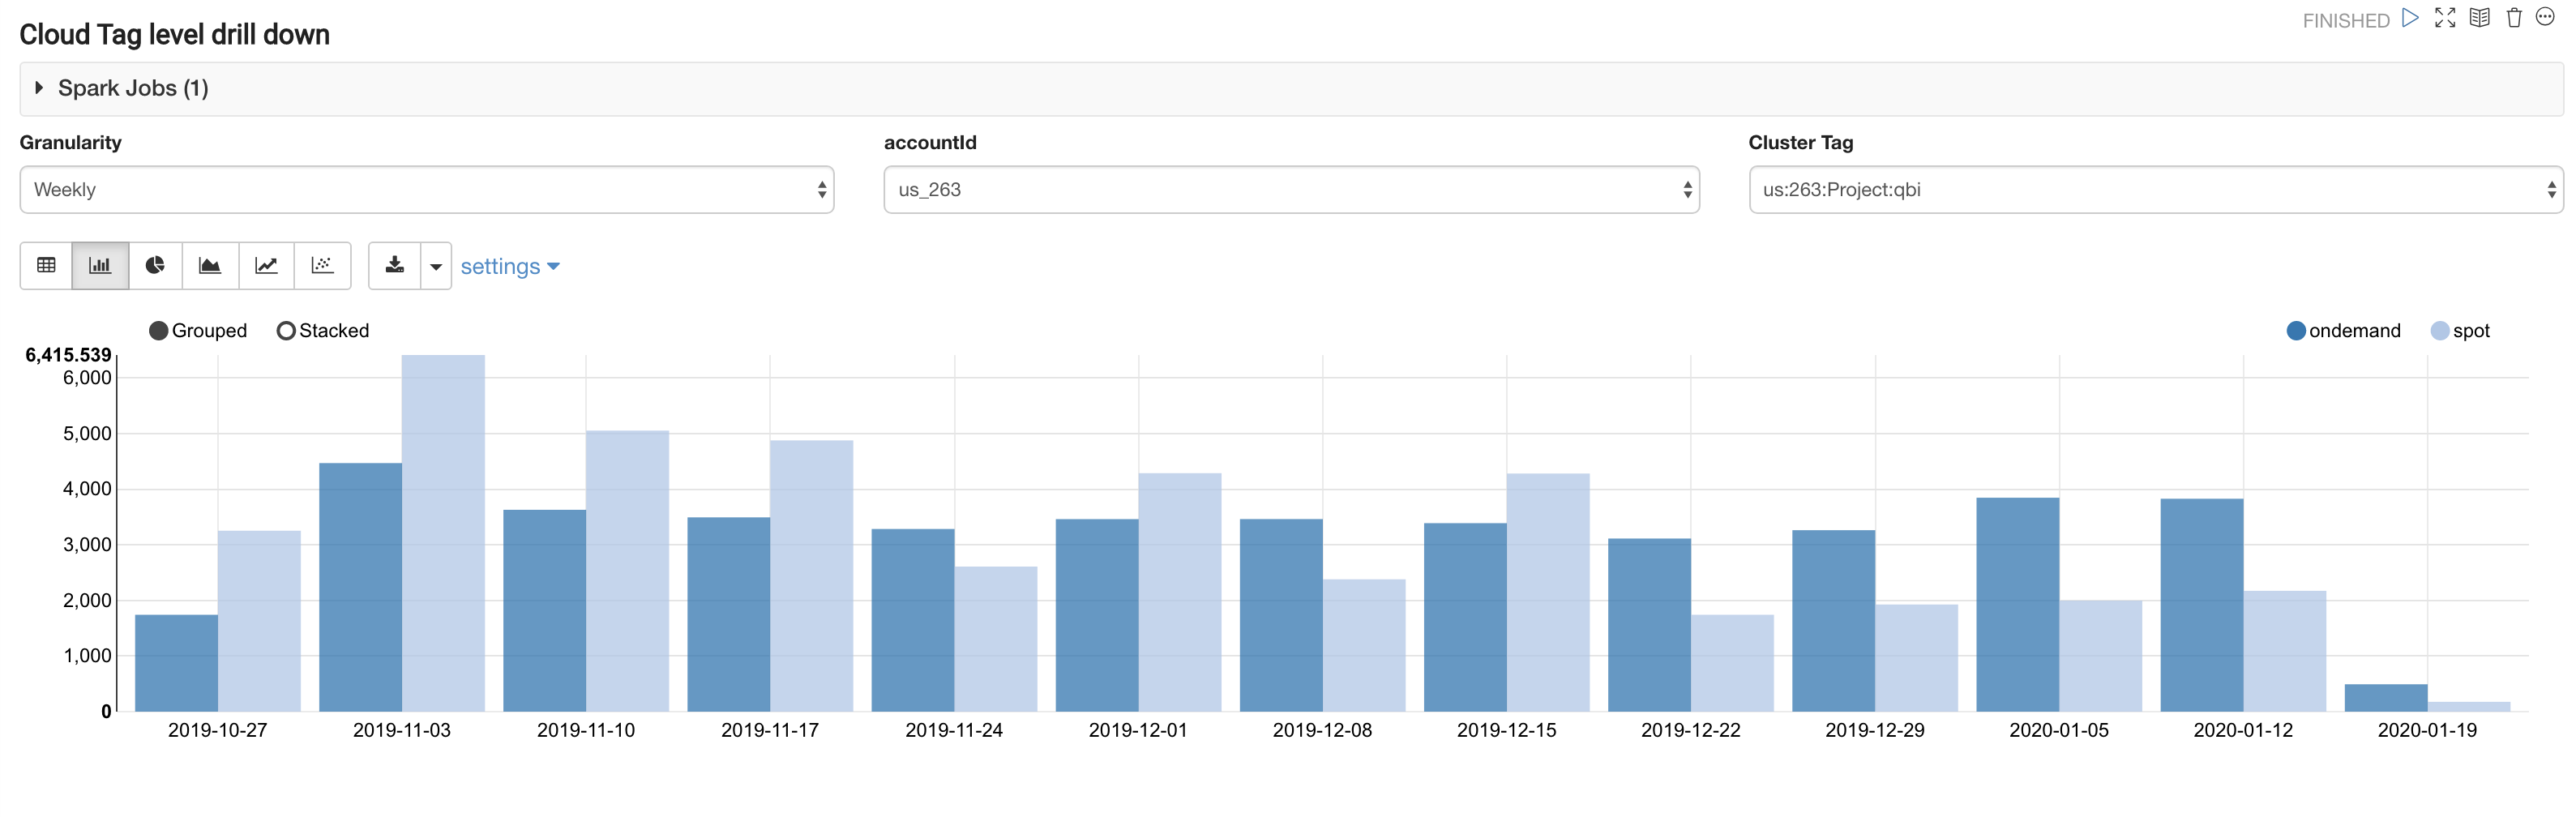
The Cloud Tag level paragraph provides the Spot vs On-Demand QCU at the chosen time granularity (monthly, weekly, daily) for a given custom Cloud tag (Ec2, Azure VM, GCP VM).
The Top K paragraph ranks the clusters based on the QCU spend for the chosen time range.
Command Cost Attribution Notebook
This notebook provides cost (Ec2 $ and QCU) attribution at the individual user and command level for a given date range.
If you are running the Command Cost Attribution notebook for the first time, Qubole recommends you run the Create Tables and Recover Partition paragraph as it executes the Hive Metastore commands, creates the necessary tables, and recovers partitions.
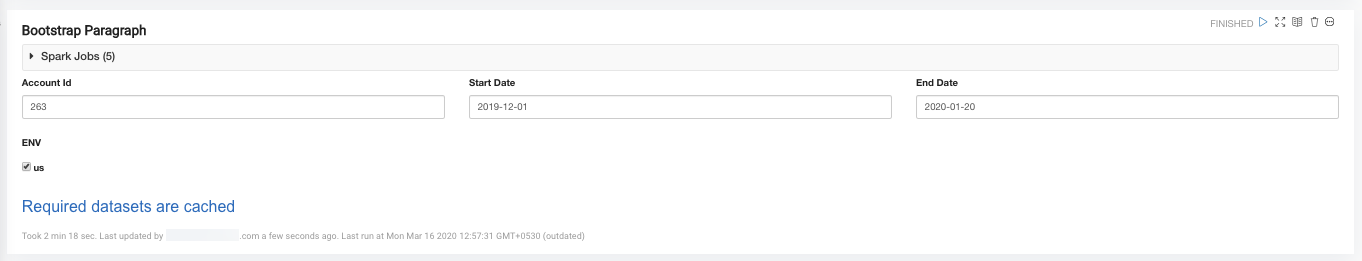
The Bootstrap paragraph creates a cached dataframe from the selected date range and filtered account ID. It enables quick iterative queries in subsequent paragraphs.
The User Attribution paragraph helps you slice and dice information. There are multiple options to select/ deselect a check box and to filter text boxes. All filter boxes accept comma-separated values such as v1, v2, v3.
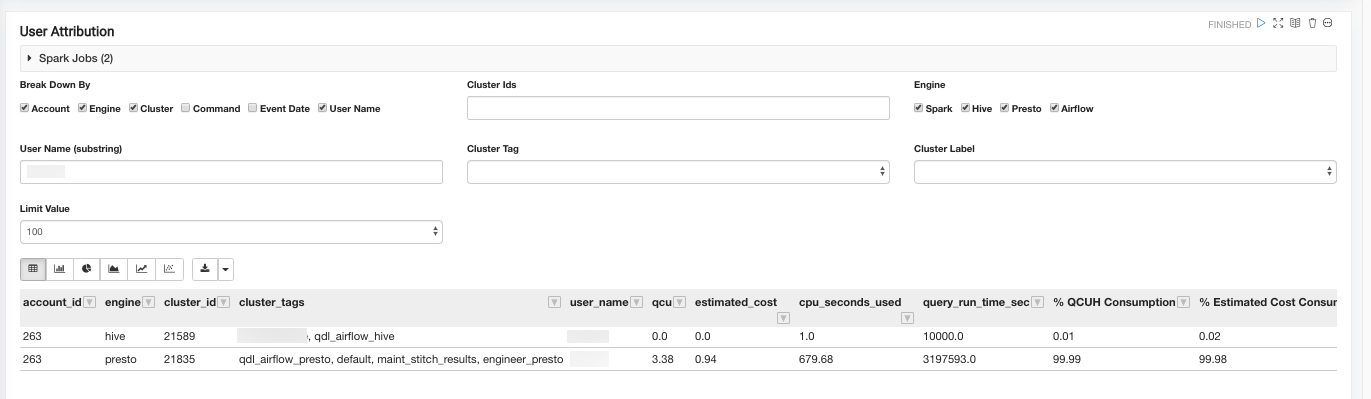
Use the Break Down By feature to produce an output only for certain dimensions.
For example, to view the cost attribution for all the users who submitted queries against cluster 10183, account 1001, enable the Account, Cluster, and User check boxes. Enter 10183 in the Cluster IDs field (accepts multiple comma-separated values) and 1001 in the Account IDs field (accepts multiple comma-separated values).
To view the cost at an individual Command level, enable the Command check box.
Note
To limit the amount of result set rows returned, use the User Email input field to look for a subset of users.
Top Workloads and Usage Notebook
Ranking Top Workloads Using User-defined Tags
This notebook lets you group and then rank the unique workloads submitted to the QDS platform based on various metadata related to the execution of the workload. For example, to know the most frequently executed query for an account, use the top queries by count ranking.
QDS extracts a variety of metadata for each command you submit. Commands with similar metadata are grouped together to form a query group that is identified by a unique similarity_identifier ID.
The following are the metadata extracted for any given query:
User-defined Tags: such as daily_sales, scheduled_2018-08-10T00:00:00
User-defined Name: such as AnalyzeCartPings
Scheduled Job ID: The unique identifier applied for scheduler commands on QDS
A series of transformations are applied to the query metadata to identify the similarity for a group of queries. The following is an example:
Normalization of user-defined tags: Certain user-defined tags are generated automatically by workflow orchestrators such as Apache Airflow. Some of these tags contain runtime information such as the execution date of the task. These can be removed as they change on a day-to-day basis. Qubole tries to identify all the run-time information from these tags and normalizes them so that the metadata across query runs remains similar.
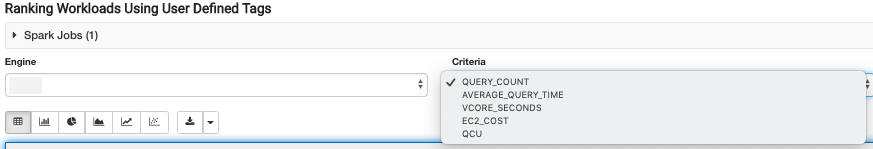
The Workloads Ranking paragraph provides a ranking of all unique workloads of an account based on the criteria chosen.
Top Queries By Count |
This workload provides a ranking of all unique workloads of an account based upon the distinct number of times it was submitted to QDS. |
Top Queries By Execution Time |
This workload provides a ranking of all unique workloads of an account based upon the average time taken for each execution. |
Top Queries By Vcores/CPU seconds |
This workload provides a ranking of all unique workloads of an account based upon the average cpu_seconds used for each execution. |
Top Queries By QCU |
This workload provides a ranking of all unique workloads of an account based upon the sum of the QCU used by each execution. |
Top Queries By Ec2 cost |
This workload provides a ranking of all unique workloads of an account based upon the sum of the Ec2 cost used by each execution. |
The Trend Analysis of Similar Queries paragraph lists all the individual and unique commands that were grouped using the Similarity Identifier. Additionally, it provides detailed metrics of all the individual commands that were grouped together. These metrics, along with the individual commands, help in debugging, query optimization (for cost or performance), anomaly detection (in query execution), and trend analysis. It takes the Similarity Identifier, that can be fetched from the Ranking Top Workloads Using User-defined Tags paragraph, as an input.
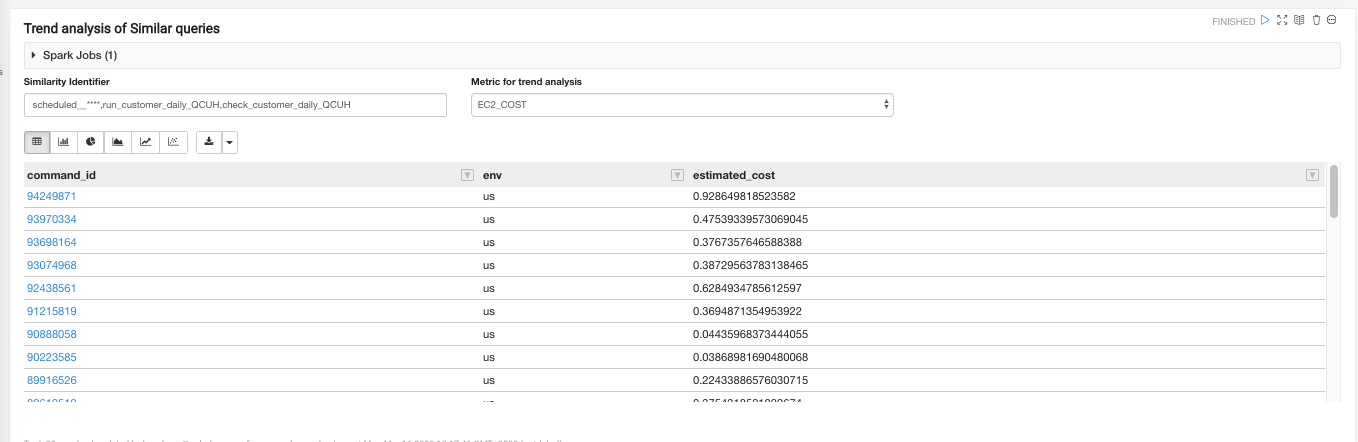
For a given Similarity Identifier, the Individual Command Runs paragraph provides the details of all the individual commands that were grouped under this particular identifier. Any command that is submitted to the clusters QDS account (Control Plane) is uniquely tagged with the Query_hist_id. The service provides the metadata and detailed metrics for every individual command.
Query_hist_id |
The unique identifier for that particular command run. |
Status |
Denotes whether this command was successfully completed. |
Created_at |
The time at which the particular command was submitted. |
Duration |
The total duration (wall clock time) for command completion. |
Cluster_id |
The cluster to which the command was submitted. |
Cluster_instance_id |
The cluster instance to which the command was submitted. The cluster instance ID is a subset of the cluster and uniquely identifies a particular cluster session (from cluster start to cluster stop). |