Self-Service SQL Analytics
For ad-hoc insights into the QCE data, you can leverage Qubole’s Workbench to query data using Hive, Spark, or Presto clusters. Viewing QCE data tables and columns next to the SQL Composer makes it easier to perform any ad-hoc data exploration.
cluster_node_usage_daily
For more information, see the Data Dictionary.
This table captures the Qubole Compute Usage (QCU) and estimated_vm_cost($) values corresponding to the daily usage of each VM/node.
Note
QCU numbers provided here are for analytical purposes and may not match formal accounting/billing data.
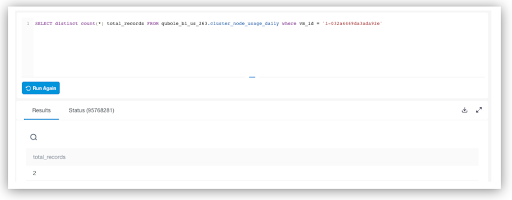
The same node can have multiple rows (one for each day) if the node runs for more than one day resulting in multiple rows for the same vm_id. To view the total number of unique nodes that were part of a cluster_instance_id, use the distinct function in your SQL. That is, to calculate the total VM $ spent at the node level, you must aggregate the estimated_vm_cost at the vm_id level.
For instance, the screenshot below displays multiple records returned for a particular node_id.
The following sample queries can get you started with the tables that are created as part of the Cost Explorer Self-service analytics.
Total Unique Nodes per Cluster Instance
This query provides the number of nodes that were provisioned as part of a particular cluster instance.
SELECT count(distinct vm_id) total_records FROM
<schema_name>.cluster_node_usage_daily where cluster_instance_id=?
Total Node Runtime per Cluster Instance
This query provides the total runtime of all the VMs that were provisioned as part of a particular cluster instance.
SELECT sum(vm_run_time)/60 node_run_time_mins FROM
<schema_name>.cluster_node_usage_daily where cluster_instance_id=?
The vm_run_time column represents the duration (in seconds) for each node that ran on a particular date (event_date). For nodes that ran across multiple days, this column represents the daily value and not the total value. To arrive at the total value, use the SUM() aggregate function.
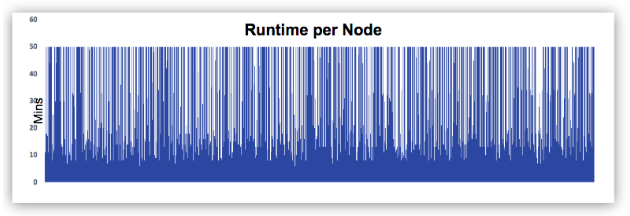
Total Runtime Per Node
Qubole autoscaling charts provide the total number of concurrent running nodes in the cluster at any time.
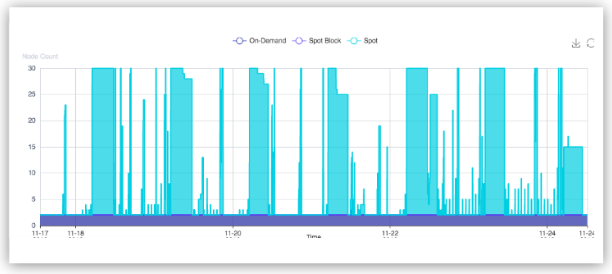
You can use the following query to generate a chart of the runtime of each node, and understand how Qubole autoscaling frequently terminates nodes when they are not required. This results in a different node duration.
SELECT vm_id, sum(vm_run_time)/60 node_run_time_mins FROM
<schema_name>.cluster_node_usage_daily where cluster_instance_id=? group by 1
QCU at the Cluster Instance level
Use the following query to derive the QCU consumption at the cluster instance level:
SELECT sum(qcu) FROM <schema_name>.cluster_node_usage_daily
where cluster_instance_id = ?
QCU is normalized across {instance_family and instance_type} while VM$ (Ec2$ for instance) varies by instance_family (weights - large, xlarge, and family - r3, r4, r5, etc.) and instance_type (Spot, On-demand, Spot-block, etc). However, as machine hours do not take into account the weight of the instance (large, xlarge, 2xlarge, etc), it hinders the consumption comparison across different clusters. QCU provides a mechanism to normalize this consumption. To understand the actual On-Demand vs Spot QCU consumption at the cluster instance level, use the following query:
SELECT vm_pricing_type, sum(qcu) FROM
<schema_name>.cluster_node_usage_daily where
cluster_instance_id = ? group by 1
clusters_metadata_daily
For more information, see the Data Dictionary.
Qubole clusters are uniquely identified using the cluster_id. However, since this ID is a numeric value, it is difficult to remember. Also, as it is Qubole-generated, it does not provide a business context.
To address these drawbacks, Qubole provides cluster metadata such as Qubole cluster labels, and cloud_tags (such as customer Ec2 tags for AWS) through the clusters_metadata_daily table.
Cluster Labels as an Array
As there can be one or more labels associated with a cluster at any point, and these labels can be moved/deleted, the cluster_label is of the Array<String> type and contains all the labels associated with the cluster.
Cloud_Tags as a Map {Key, Value}
Unlike cluster labels, Custom VM tags (i.e, cloud tags) are two-dimensional {key, value}.
The cluster_label is of the map{key, value} type, and contains all the custom VM tags associated with the cluster.
Use this table, along with the cluster_node_usage_daily table, to view the daily cost associated with a particular cluster label.
SELECT a.event_date,a.account_id,a.env,a.cluster_label,sum(qcu) as qcu,
sum(estimated_vm_cost) as `cost($)`
from(select event_date, account_id, cluster_id, env,explode(cluster_labels) as
cluster_label
from <schema_name>.clusters_metadata_daily
where event_date >='2019-12-15'
and event_date <='2019-12-20'
and env = 'us') a
join (select *
from <schema_name>.cluster_node_usage_daily
where event_date >='2019-12-15'
and event_date <='2019-12-20'
and env = 'us' ) b on a.event_date = b.event_date and a.env = b.env
and a.cluster_id = b.cluster_id
group by a.event_date,a.account_id,a.env,a.cluster_label;
Use the following query to understand the daily cost at the cloud_tag level:
SELECT a.event_date,a.account_id,a.env,a.cloud_tags,sum(qcu) as qcu,
sum(estimated_vm_cost) as `cost($)`
from(select event_date, account_id, cluster_id, env,concat_ws(':',key,value) as cloud_tags
from(select event_date, account_id, cluster_id, env,explode(cloud_tags)
from <schema_name>.clusters_metadata_daily
where event_date >='2019-12-15'
and event_date <='2019-12-20'
and env = 'us') t ) a
join (select *
from <schema_name>.cluster_node_usage_daily
where event_date >='2019-12-15'
and event_date <='2019-12-20'
and env = 'us' ) b on a.event_date = b.event_date and a.env = b.env and
a.cluster_id = b.cluster_id
group by a.event_date,a.account_id,a.env,a.cloud_tags;
command_usage
For more information, see the Data Dictionary.
This table stores the command level usage metrics and provides cost information for users and jobs. For each command, Qubole attributes vcore-seconds, QCU, and estimated cost ($) in the command run. In general, there is only one record per command.
For workflow command types or commands with multiple statements, there can be multiple sub-commands triggered internally. In such cases, there are multiple records in the table for the same command_id but the engine_identifier is different for each sub-command. The number of records for that command_id are the same as the number of associated sub-commands. Usage metrics and status in these cases correspond to each sub-command. To find command level usage, metrics must be aggregated across all the records of that command_id.
Parameter |
Detail |
|---|---|
command_id |
Qubole generated command identifier. This is null i) for commands that are directly submitted to clusters or ii) if Qubole is unable to attribute usage of a cluster to a particular command. |
engine_identifier |
|
When Qubole can attribute usage of a cluster instance to a command, records are available for that day with both the command_id and the engine_identifier having null values. The user_identifier in such cases is idle.
The possible reasons for not being able to attribute usage to a particular command are:
An unsupported cluster version as the cluster has not been restarted for a while
Unsupported custom packages on the cluster
Data collection has been disabled (for Qubole)
Note
For commands running across days, the command record is created on the day the command ended.
As this table contains all the required metrics of a given command, you can use it as a substitute for the All Commands report.