Building Assisted Streaming Pipelines
You can build streaming pipelines from the Pipelines UI by using the using out-of-box connectors and operators (in assisted mode) offered by Qubole Pipelines Service.
You can also run your streaming pipelines by using the Pipelines APIs. For more information, see Introduction to Qubole Pipelines Service APIs (Pipelines APIs).
Note
You must ensure that the Pipelines resource is allowed for your role to create a streaming pipeline. Additionally, you must have the access to run Spark commands to run the streaming pipelines.
Building assisted streaming pipeline involves the following steps:
Navigate to the Pipelines page.
Click +Create new.
Click Build Assisted Pipeline.
Enter a name for the pipeline. The pipeline name must be unique. The name you entered helps you discover the pipeline in the State-of-the-Union view.
Setting up the Source
You can set up Apache Kafka, Amazon Kinesis, or Amazon S3 as the source for your streaming pipeline.
Apache Kafka
Schema Registry is now integrated with the Pipelines UI for streaming pipelines. With this integration, you can fetch schemas from the Kafka cluster on the Confluent platform.
If you want to use Schema Registry with your Kafka cluster, perform the following steps:
Ensure that the Schema Registry is installed and configured on the Confluent platform. For more information, see Schema Registry Documentation.
Ensure that the Qubole’s NAT gateway/ tunnel servers have a networking path to the Kafka cluster.
From the Pipelines home page, select Schema Registry on the left pane.
If you want to create a new registry, click +New Registry.
Enter the name, description, and registry type for the registry.
Enter the credentials for your Kafka cluster that is running on the Confluent platform to establish a connection.
If the cluster is in a private subnet, then select Use bastion node option. Enter the bastion node details such as username, port, IP address, and private key to establish the connection.
Click Confirm.
The newly created registry is displayed. You can edit the registries.
To set up Apache Kafka as the source, you should enter the following details in the Source section.
Note
Options marked in bold below are mandatory. Others are optional and have default values.
Option |
Description |
|---|---|
Bootstrap servers |
A list of host/port pairs to establish the initial connection to the Kafka cluster. Comma-separated list of host:port. This list should be in the form
|
Topics |
A topic is a category or feed name to which records are published. Supported topics are : Multiple, which is a comma-separated list of topics, and Pattern, which is a Java regular expression of topics. |
Input format |
Data Format of the messages read from Kafka. Possible values: |
Add additional columns in the source dataframe |
Any column that should be added as part of the source dataframe. Currently, only |
Schema |
Schema of the records. Note Enter master json schema. It is recommended to keep it backward compatible. If you want to use Schema Registry, select Auto-fetch. Select a Registry and a subject from the respective drop-down lists, and click Fetch. The latest schema of that subject is fetched in the Schema field. If you want to edit the fetched schema, click on the Edit icon below the Schema field. The UI changes to Write your own mode and you can edit the fetched schema. Note Edits made to the fetched schema are local and are not saved to the remote schema on the Kafka cluster. |
Offsets |
Offset is a sequential id that uniquely identifies each record within the partition. Specifying the offset sets the starting point. Possible values: |
Custom tune kafka connection by overriding defaults |
Specify any required Kafka override options. |
For more information about the Kafka configuration, see https://kafka.apache.org/documentation/#configuration.
AWS Managed Kafka Service is also supported. For details, see https://docs.aws.amazon.com/msk/latest/developerguide/getting-started.html.
Amazon Kinesis
To set up Amazon Kinesis as the source, you should enter the following details in the Source section.
Note
Options marked in bold below are mandatory. Others are optional and have default values.
Option |
Description |
|---|---|
Endpoint URL |
Entry point for the Kinesis stream. |
Stream name |
Kinesis Data Stream to read from. |
Starting Position |
Specifies a starting point to read from the stream. |
Input format |
Data format of messages in queue read from Kinesis. Currently, only JSON is supported. |
Add additional columns in the source dataframe |
Any column that should be added as part of the source dataframe.
Currently, only |
Schema |
Schema of the records. Note Enter master json schema. It is recommended to keep it backward compatible. |
Custom tune Kinesis connection by overriding defaults |
Specify any required Kinesis override options. |
Amazon S3
To set up Amazon S3 as the source, you should enter the following details in the Source section.
Note
Options marked in bold below are mandatory. Others are optional and have default values.
Option |
Description |
|---|---|
S3 Path |
Path for the source directory on S3. |
Input format |
Data format of messages in queue read from S3. Possible values: |
Schema |
Schema of the records. Note Enter master json schema. It is recommended to keep it backward compatible. |
Other configurations |
Specify any required S3 override options. |
Custom tune file sources by overriding defaults |
Specify any required S3 override options. |
After setting up the source, click Next: Select Sink.
Example
The following animated GIF shows how to set up the source.
Setting up the Sink
S3
To set up S3 as the sink, you should enter the streaming sink details in the Sink section.
Select S3.
Enter the path for the destination directory on S3.
Enter partition columns to partition your data for faster downstream SQL access. For example, if you have columns such as Year, Month, Day as part of your schema, specify them in the correct order. The application automatically creates and writes data to the correct partition and also handles late arrival of data.
Select the output format from the Output format drop-down list. JSON, CSV, and Parquet are the supported output formats.
Enter sink specific configurations such as user defined metadata for s3 objects in the Add user-defined metadata to objects field.
After setting up the sink, click Next: Set Properties.
Example
The following animated GIF shows how to set up S3 sink.
Hive Tables
To set up Hive as the sink, you should enter the streaming sink details in the Sink section.
Select Hive.
Select the required database from the Database drop-down list.
Select the required table from the Table name drop-down list.
Enter sink specific configurations in the Custom tune metastore operations field.
After setting up the sink, click Next: Set Properties.
Example
The following animated GIF shows how to set up Hive sink.
Kafka
To set up Kafka as the sink, you should enter the streaming sink details in the Sink section.
Select Kafka.
Enter bootstrap servers as a list of host/port pairs to establish the initial connection to the Kafka cluster.
Enter topic names as a comma-separated list.
Select the format for sink from the Format drop-down list.
Enter sink specific configurations in the Custom tune kafka connection by overriding defaults field.
After setting up the sink, click Next: Set Properties.
Example
The following animated GIF shows how to set up Kafka sink.
Snowflake
To set up Snowflake as the sink, you should enter the streaming sink details in the Sink section.
Select Snowflake.
If you want to set up a Snowflake data store, then click Setup Snowflake Datastore.
The Explorer page opens as a separate tab. Select Snowflake from the Database Type drop-down list and enter the following details in the respective fields.
Name for the Data Store.
A unique name for Snowflake catalog.
Name of the database.
Name of the warehouse.
Address of the host.
Username and password for the host.
User private key. You must specify this user private key to use this data store for streaming pipelines.
After the data store is created, the newly created snowflake data store is displayed in the Sink section of the Pipelines UI.
Navigate back to the Sink section of Pipelines UI.
If the Snowflake data store exists, select the required catalog from the Catalog drop-down list.
Enter the warehouse name.
Enter streaming stage that should be used to load data from files into Snowflake tables and unload data from tables to files.
Enter snowflake database name.
Enter the snowflake table name in the database.
Enter sink specific configurations in the Override Schema field.
After setting up the sink, click Next: Set Properties.
Example
The following animated GIF shows how to set up Snowflake sink.
Setting the Properties
You can add the information about the cluster, engine configuration overrides, location for dependent jars, UDFs, and streaming configuration in the Set Properties section.
Select a suitable Spark streaming cluster from the Select cluster drop-down list.
If there are no Spark streaming clusters available, create a new Spark streaming cluster by clicking on the Create Streaming cluster hyperlink. The Create New Cluster page opens in a separate tab.
Select Spark Streaming and click Next or Create.
In the Configuration tab, enter a cluster label in the Cluster Labels field.
Verify the default values. Modify them if required, click Next.
Enter the values in the relevant fields in the Composition tab, and click Next.
In the Advanced Configuration tab, ensure the following options are enabled:
Enable Prometheus
Disable Timeout for Long Running Task
Enable Log Rolling
Click Create.
Navigate back to the Pipelines UI.
Refresh the page to ensure that the newly created Spark streaming cluster is visible in the drop-down list.
The following animated GIF shows how to create a Spark streaming cluster and set up properties.
If you want to enable the Retry on failure option, select Yes. When this option is enabled, the pipeline is run with auto retries with exponential backoff if it fails due to intermittent errors.
Enter the Spark override configurations, location of dependent jar files and UDFs in the Engine Configuration field.
Enter the following information for the Streaming configuration:
Directory location for checkpointing to recover from a failure.
Note
This location should be unique across all active and inactive pipelines.
Interval in seconds to trigger the pipelines.
Set Trigger interval for the system to check availability of new data. If this is not specified, the system checks for availability of new data when the previous processing is completed. If a trigger time is missed because of the previous incomplete processing, then the system triggers processing immediately.
Output mode specifies what is written to the output sink. The supported values are Append, Complete, or Update.
Append: This is the default value. In this mode, only the new rows added to the Result Table since the last trigger are written to the sink.
Complete: The whole Result Table is written to the sink after every trigger. This is supported for aggregation queries.
Update: Only the rows in the Result Table that are updated since the last trigger are written to the sink.
After setting the properties, click Next: Assisted Code.
Selecting the Assisted Code
You can add the predefined operators in the Assisted Code section.
From the Draw tab, click the Operators icon.
Select an operator and enter the properties for the pipeline. Select, Filter, Aggregation, and Watermark are the supported operators.
Click Apply. The added operators are displayed as shown below.
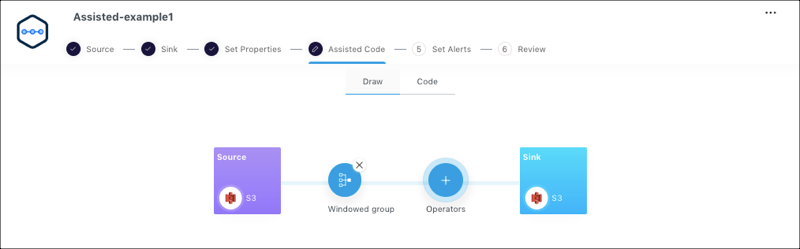
If you want to delete the operator, click on the cross mark of the operator. You can delete the operators sequentially, starting from the last added operator.
Optional: You can view the code in the Code tab.
If you want to edit the code, click Edit Code. The auto-generated code for the pipeline opens in the Build using Custom Code UI. You can use this code as boiler-plate code, which is completely extensible. Scala is the supported programming language. Edit the code and follow the instructions as mentioned in Building Streaming Pipelines using Custom Jars or Code.
The following animated GIF shows how to edit the code from the Assisted Code section.
Click Test Run to verify the pipeline for business logic accuracy.
The TEST RUN operation reads limited records (10 records) from source, applies the logic, and writes the output to console in the Results tab. It also maintains separate temporary checkpoint location to prevent any corruption to your runtime production checkpoint. As the output is written only to the console, the production sink is clean and healthy. Test runs time out after a specified number of triggers.
The events, logs, and results are displayed in the respective tabs.
You can view the command logs of the test run in the Events tab. Details such as started, queued, running, cancelled or stopped are displayed. Additionally, an event is also displayed when the connection to Kafka source is not established.
You can check the logs to debug and identify any errors or warnings.
After selecting the assisted code, click Next: Alerts.
Example
The following animated GIF shows the predefined out of box operators.
Setting up Alerts
To receive alerts when your pipeline fails or manually stopped by a user, you can set up alerts on one or more channels in the Set Alerts section. You can either use predefined channels or create a new channel.
Ensure that the Receive alerts on selected channel(s) when your pipeline fails option is selected.
Select the required channels from the drop-down list. The supported channels are: Slack, Email, Webhook, and Pagerduty.
If you want to create a new channel, click Create channel. Control Panel with Notification Channels is displayed in a new tab. See Creating Notification Channels.
After setting up the alerts, click Next: Review.
Example
The following animated GIF shows how to set up the alerts.
Deploying the Streaming Pipeline
The Review section displays graphical representation of your streaming pipeline. Additionally, it also displays the summary and details of the source, sink, and the various properties set.
Click Deploy Now to run the pipeline.
You pipeline now runs and the Pipelines home page with the State-of-the-Union view displayed.
Example
The following animated GIF shows how to deploy the pipeline.
After building and deploying your pipelines, you can manage and monitor the pipelines.