Presto Metrics on the Default Datadog Dashboard
Qubole Presto supports Datadog monitoring and it also supports metrics on Datadog dashboards.
Note
The feature to use the Datadog UI is not available by default. Create a ticket with Qubole Support to enable this feature on the QDS account.
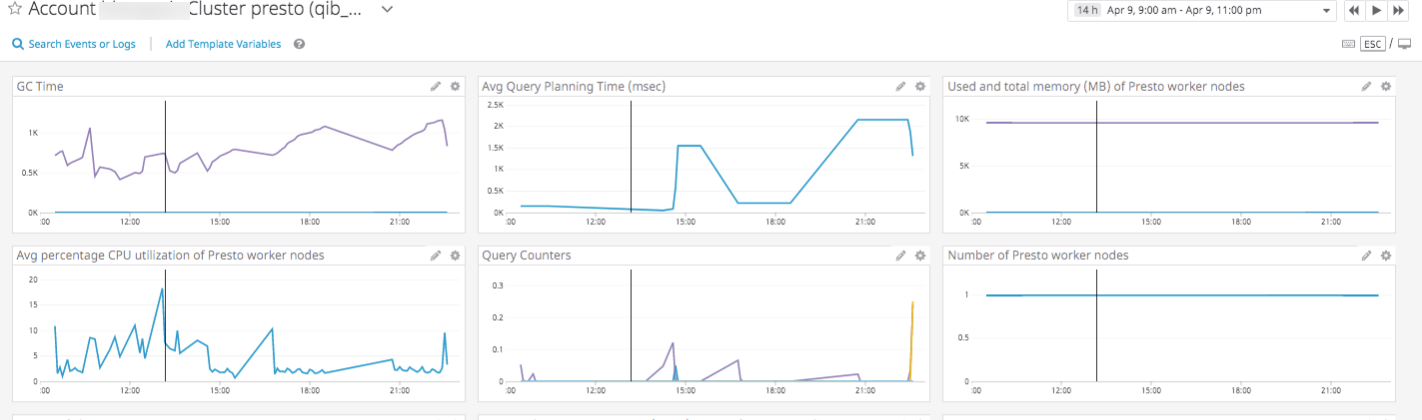
When Datadog monitoring is configured on a Presto cluster, the metrics of an active cluster are displayed on a default Datadog dashboard. The default Datadog dashboard metrics are:
presto.jmx.gc.minor_collection_timepresto.jmx.avg_planning_timepresto.jmx.qubole.workerspresto.jmx.running_queriespresto.jmx.completed_queriespresto.jmx.failed_queries
Note
Understanding the Presto Metrics for Monitoring provides more details on the metrics and the actions that you can do to remove the cause of errors.
In addition to the default Presto metrics that Qubole sends to Datadog, you can also send other Presto metrics to Datadog.
Qubole uses Datadog’s JMX agent through jmx.yaml configuration file in its Datadog integration. It uses 8097 as
the JMX port. This enhancement is available for a beta access and it can be enabled by creating a ticket with
Qubole Support.
As a prerequisite, you must enable Datadog monitoring on the Presto cluster.
Enabling Datadog
Enable Datadog monitoring at the QDS account level from Control Panel > Account Settings in the QDS UI; this applies the settings to all clusters in that account. For more information, see Configuring your Account Settings.
You can override the account settings for an individual cluster; use the Advanced Configuration tab of the Clusters page of the QDS UI, as described under Advanced configuration: Modifying Cluster Monitoring Settings. Create a New Cluster describes how to do this using an API call.
Viewing the Default Datadog Dashboard
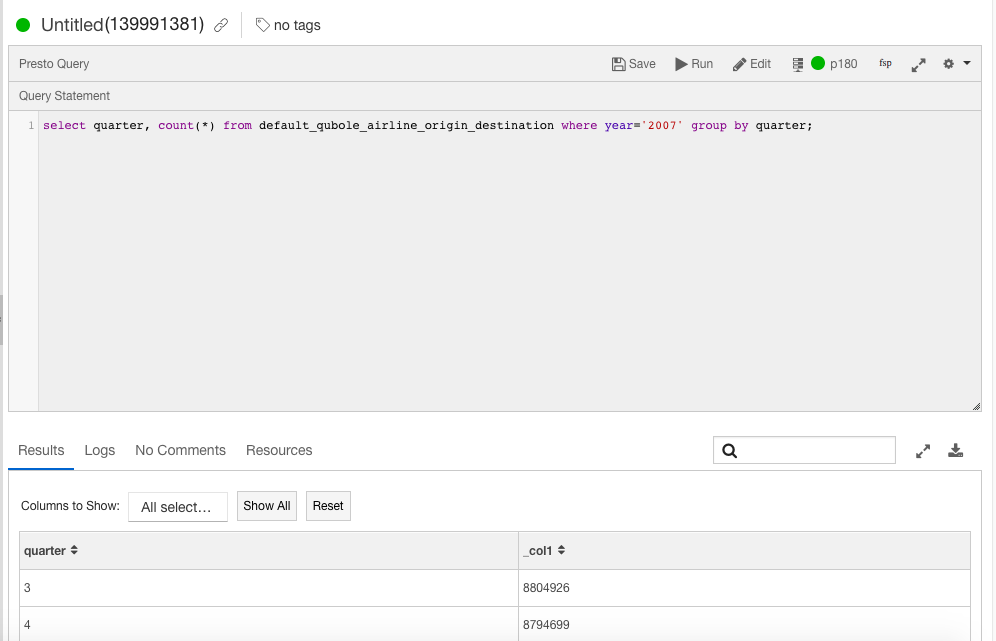
After enabling Datadog on the QDS account/cluster, the Datadog metrics related to Presto are displayed on the Datadog UI. For example, run a Presto query on the QDS UI (or API).
Here is an example of a Presto query.
Log into the Datadog and navigate to Dashboards. You can find the Presto dashboards in the list. Here is an illustration of the Datadog dashboards.
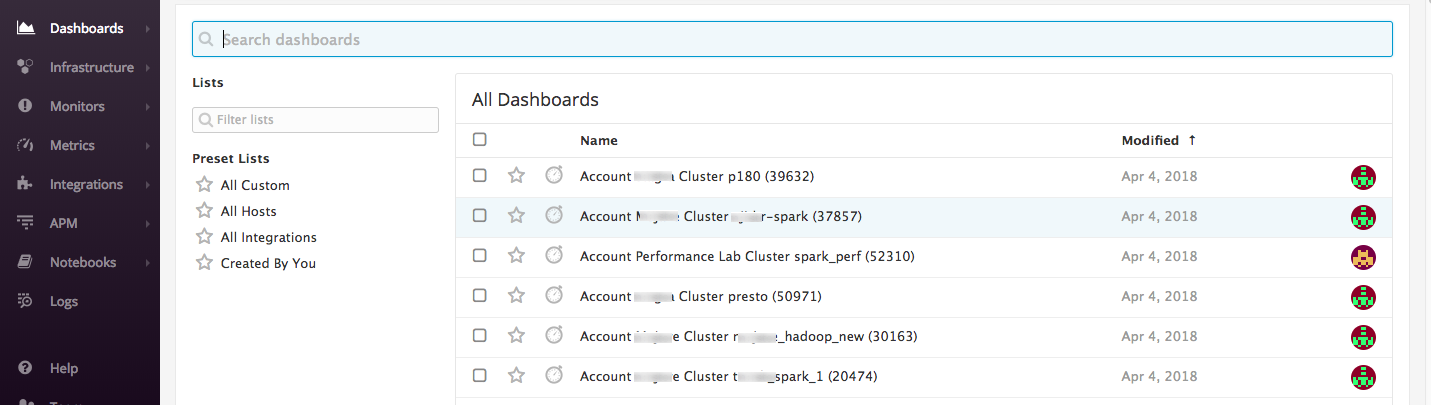
Click the default Datadog which is named with this convention - Account <account owner> Cluster <label> (<cluster ID>).
You can see the default Datadog metrics. Here is an example of the Presto metrics on the default Datadog dashboard.
Default Alerts as Set by QDS
Qubole has set these alerts by default:
You receive an alert if the
presto.jmx.avg_planning_timeis greater than 2 minutes.You receive an alert if runaway splits occupying execution slots for more than 10 minutes.
You receive an alert if the
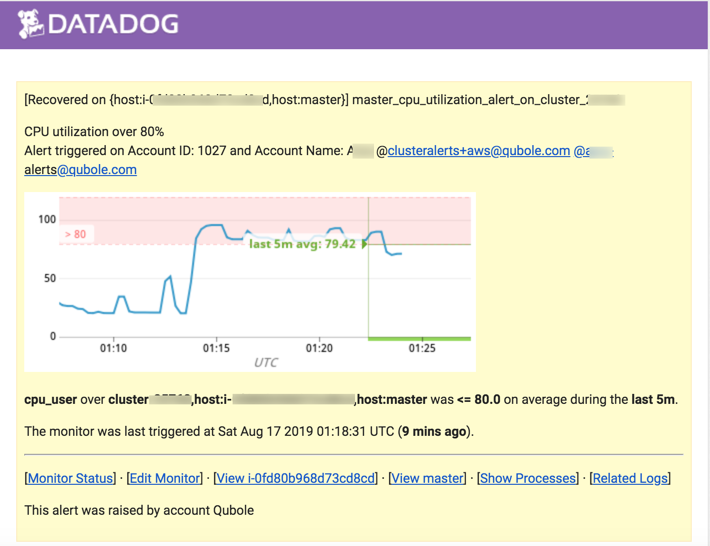
Coordinator Average Heap Memory Usageis more than 90%.You receive an alert if the current spot nodes percentage by the desired spot percentage ratio is lower than 80% on an average for 4 hours.
You receive an alert if the coordinator’s Presto server open file descriptor has exceeded its limit.
If you want to customize the threshold values or alerts about other metrics, you can set such alerts/values. For information on how to create alerts and configure email notifications, see the Datadog Alerts description.
Here is an example of the coordinator CPU utilization alert.
Understanding the Presto Metrics for Monitoring provides more details on the metrics and the actions that you can do to remove the cause of errors.