Monitoring Presto through Prometheus
Presto has added support for Prometheus monitoring tool with the default Presto dashboard capturing various JMX metrics, which you can view through Grafana. This feature is available through Gradual Rollout.
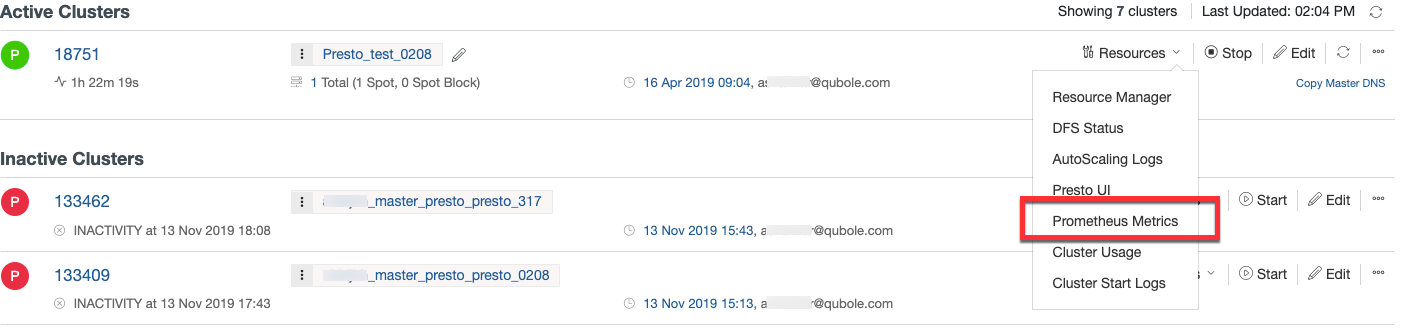
The hyperlink is accessible under the Resources drop-down list on the Clusters UI page as illustrated in this figure.
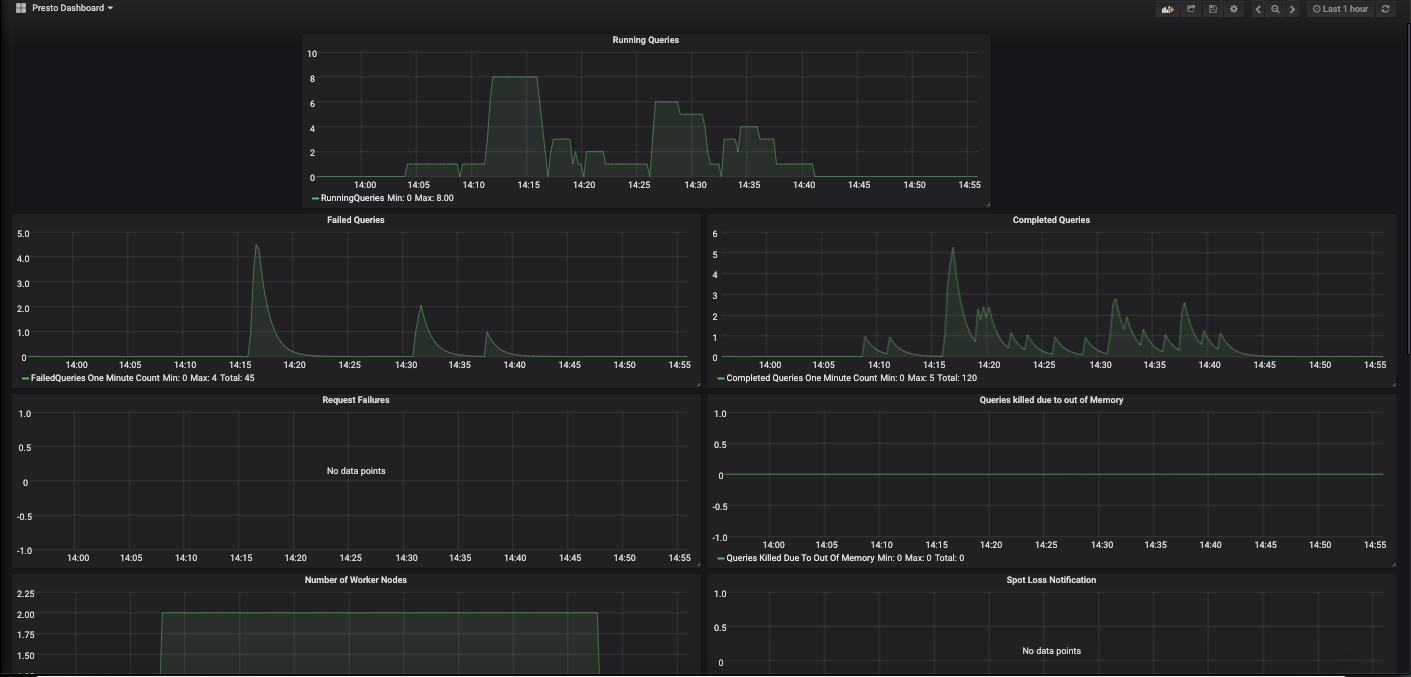
Click Prometheus Metrics to see the dashboard. An example of the Prometheus dashboard with Presto metrics is illustrated in this figure.
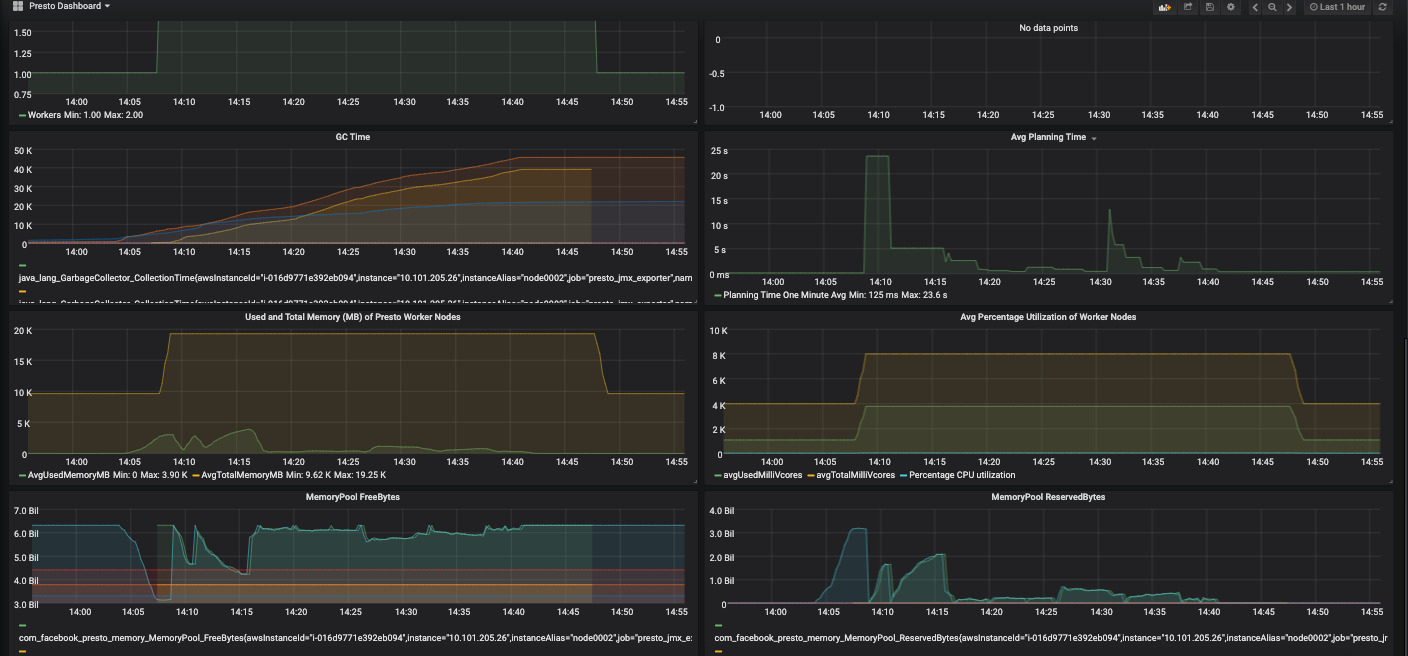
The following example shows the extended dashboard that includes GC Time, Average Planning Time, and Used and Total Memory of Worker Nodes.