Understanding the HiveServer2 Metrics
HiveServer2 is available on Hadoop2 (Hive) clusters. You can enable HS2 on a Hadoop 2 (Hive) cluster as described in Configuring a HiveServer2 Cluster.
QDS supports Datadog monitoring for HS2. You can configure the Datadog monitoring service at the cluster level as described in Advanced configuration: Modifying Cluster Monitoring Settings.
For more information on configuring the Datadog monitoring service at the account level in Control Panel > Account Settings, see Configuring your Access Settings using IAM Keys or Managing Roles.
Qubole also provides a default dashboard on Datadog and alerts to monitor HS2 metrics. If you want to customize the threshold values or alerts about other metrics, you can set such alerts/values. For information on how to create alerts and configure email notifications, see the Datadog Alerts description.
This section describes:
Metrics associated with the Query Lifecycle Execution
Metric |
Description |
|---|---|
hive.hs2.waiting_compile_ops.count |
It denotes the number of queries waiting to be compiled on HS2. |
hive.hs2.submitted_queries.count |
It denotes the number of queries submitted on HS2. |
hive.hs2.compiling_queries.count |
It denotes the number of queries being compiled on HS2. |
hive.hs2.executing_queries.count |
It denotes the number of queries being executed on HS2. |
hive.hs2.failed_queries.count |
It denotes the number of queries failed on HS2. |
hive.hs2.succeeded_queries.count |
It denotes the number of queries succeeded on HS2. |
Metrics associated with Active Queries
Metric |
Description |
|---|---|
active_calls_hive.hs2.executing_queries |
It denotes the number of queries currently executed on HS2. |
active_calls_hive.hs2.compiling_queries |
It denotes the number of queries currently compiled on HS2. |
active_calls_hive.hs2.submitted_queries |
It denotes the number of queries currently submitted on HS2. |
Metrics associated with Execution Engines
Metric |
Description |
|---|---|
hive.hs2.mapred_tasks.count |
It denotes the number of queries that have run with MapReduce as the execution engine. |
hive.hs2.tez_tasks.count |
It denotes the number of queries that have run with Tez as the execution engine. |
Metrics associated with HS2 Sessions
Metric |
Description |
|---|---|
hive.hs2.session.open_sessions |
It denotes the number of open sessions on HS2. |
hive.hs2.session.active_sessions |
It denotes the number of active sessions on HS2. |
hive.hs2.session.avg_open_session_time |
It denotes the average session time of open sessions on HS2. |
hive.hs2.session.avg_active_session_time |
It denotes the average session time of active sessions on HS2. |
Metrics associated with the Memory
Metric |
Description |
|---|---|
hive.hs2.memory.total_used |
It denotes the total memory used by HS2. |
hive.hs2.memory.heap_used |
It denotes the total heap memory used by HS2. |
hive.hs2.memory.pools_CMS-Perm-Gen_usage |
It denotes the total Permanent Generation (PermGen) used by HS2. |
Metrics associated with the Garbage Collection
Metric |
Description |
|---|---|
hive.hs2.gc.ConcurrentMarkSweep_count |
It denotes the number of ConcurrentMarkSweep GC events. |
hive.hs2.gc.ConcurrentMarkSweep_time |
It denotes the time taken by ConcurrentMarkSweep GC events. |
hive.hs2.gc.ParNew_count |
It denotes the number of ParNew GC events. |
hive.hs2.gc.ParNew_time |
It denotes the time taken by ParNew GC events. |
Default Dashboard for HS2 Metrics
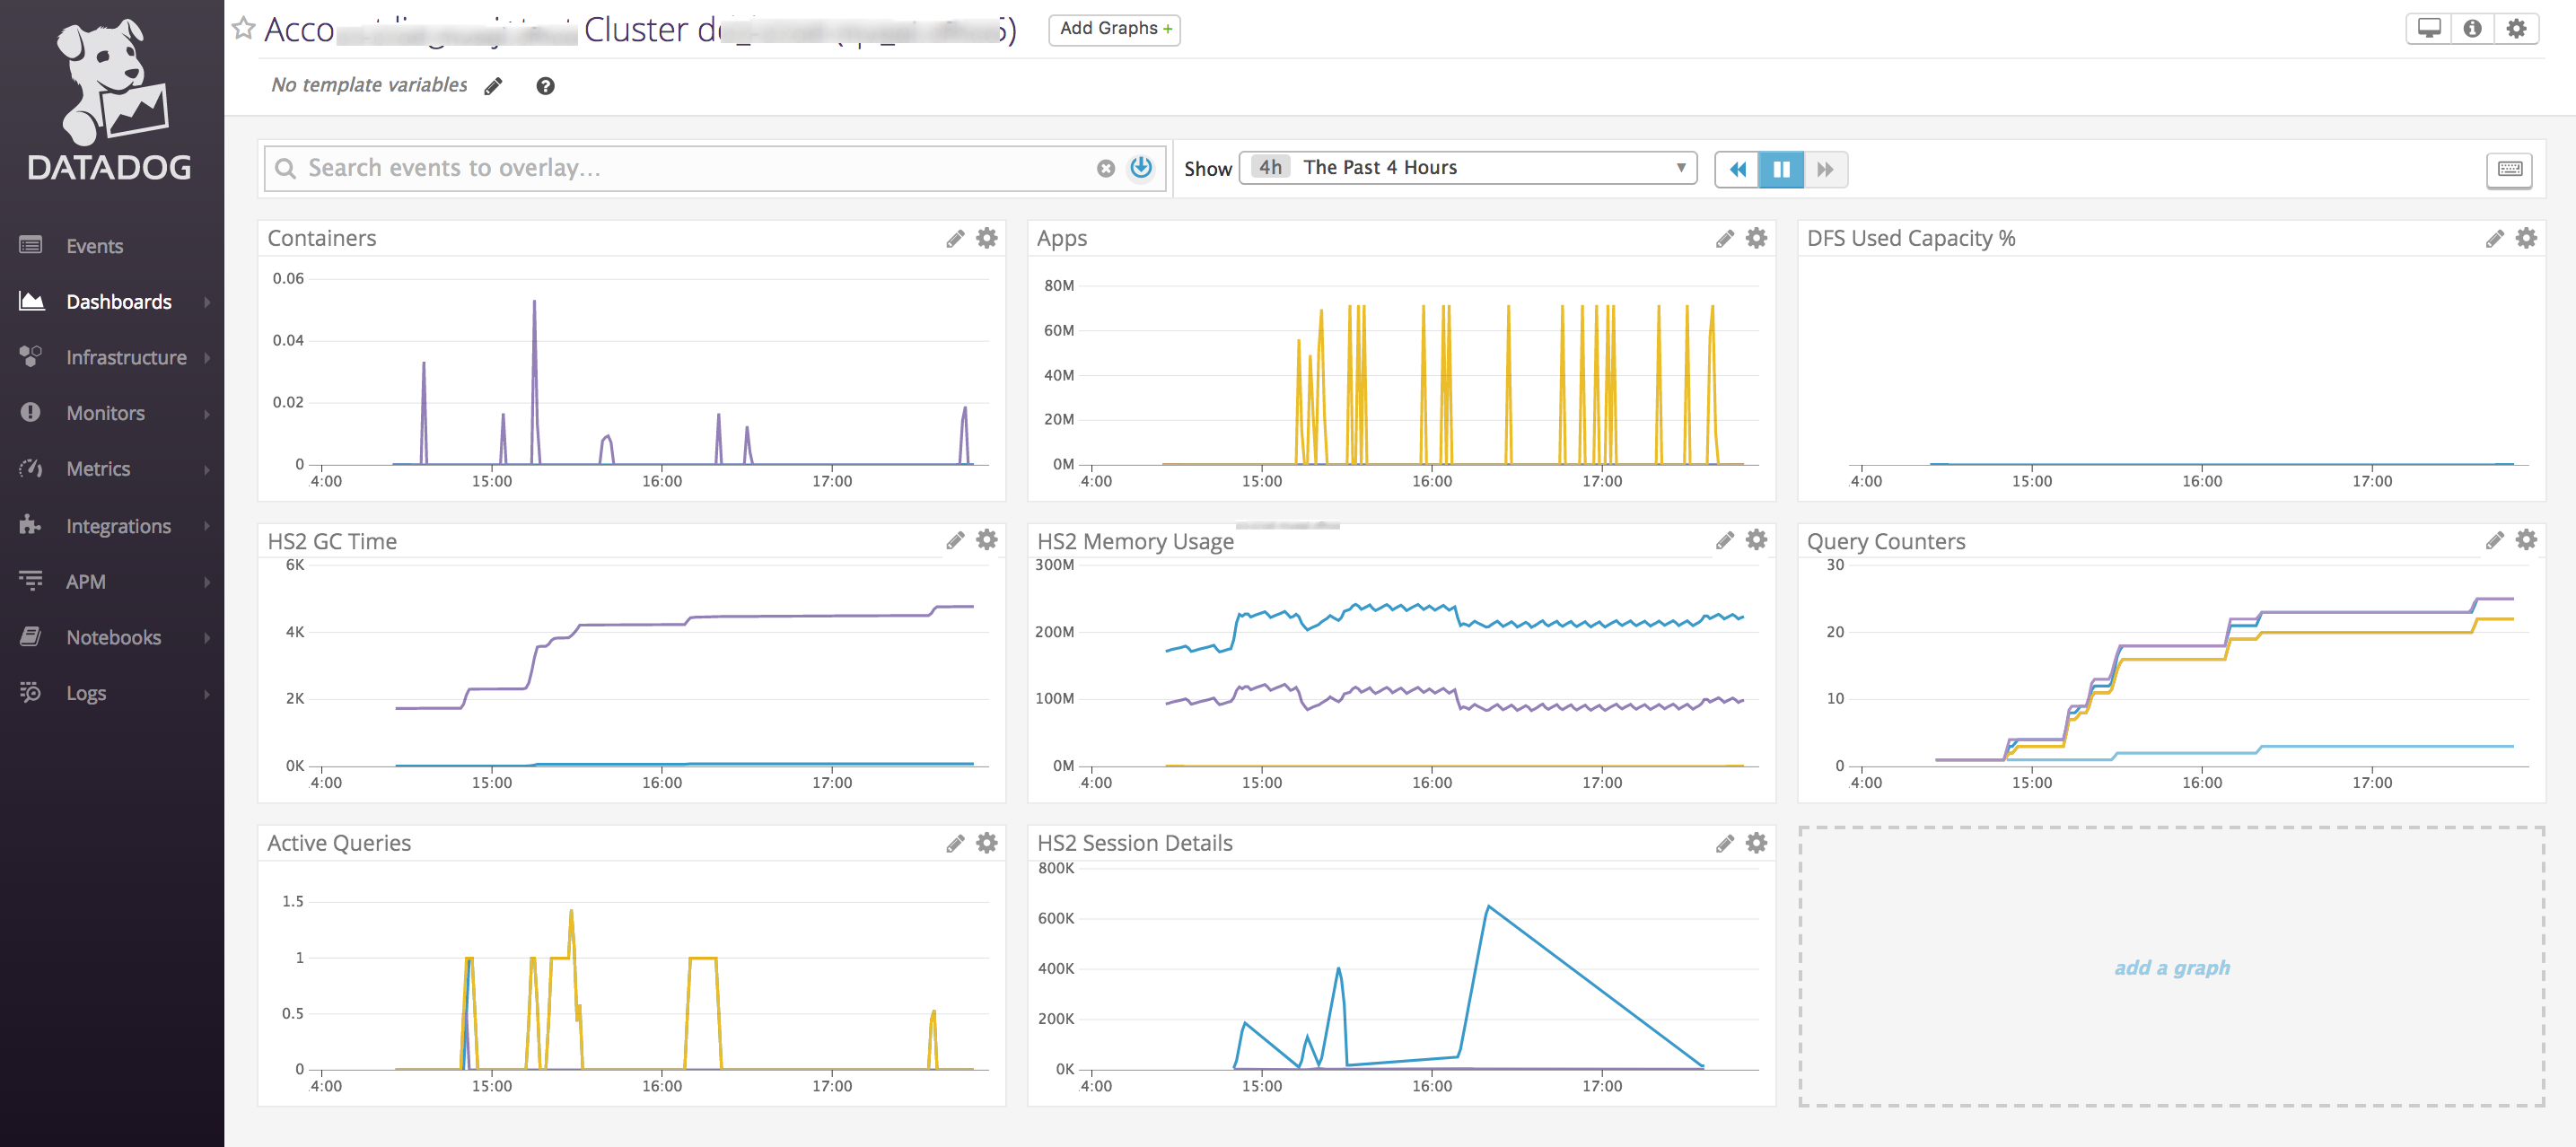
The default dashboard that is available on Datadog contains these HS2 metrics:
HS2 GC TimeHS2 Memory UsageActive QueriesHS2 Session DetailsQuery Counters
Here is a sample of the default dashboard.
