Presto FAQs
How is Presto different from Hive?
As a user, there are certain differences that you should be aware about Presto and Hive, even though they are able to execute SQL-like queries.
Presto:
Does not support User-defined functions (UDFs). However, Presto has a large number of built-in UDFs. Qubole provides additional UDFs, which can be added only before the cluster startup and runtime UDF additions such as Hive are not supported.
Does not support JOIN ordering. Ensure that a smaller table is to the right of the JOIN token.
How is Qubole’s Presto different from open-source Presto?
Note
Presto is supported on AWS, Azure, and GCP Cloud platforms; see QDS Components: Supported Versions and Cloud Platforms.
While Qubole’s Presto offering is heavily based on open-source Presto, there are a few differences. Qubole’s Presto:
Supports inserting data into Cloud Object Storage directories
Supports INSERT OVERWRITES
Supports autoscaling clusters
Supports Rubix to cache data from the Cloud on cluster storage, improving performance
Supports GZIP compression
Supports JDBC/ODBC through Qubole drivers
Supports Zeppelin and you can create Presto notebooks to run paragraphs as described in Using Different Types of Notebook.
Supports data traffic encryption among the Presto cluster nodes
Supports additional connectors such as Kinesis and SerDes such as AVRO and Openx JSON
Where do I find Presto logs?
The coordinator cluster node’s logs are located at:
DEFLOC/logs/presto/cluster_id/cluster_start_time/master/
DEFLOC/logs/presto/cluster-id/cluster_start_time/master/queryinfo/
The worker cluster node’s logs are located at: DEFLOC/logs/presto/cluster_id/cluster_start_time/nodeIP/node_start_time/
Where:
DEFLOC refers to the default location of an account.
cluster_id is the cluster ID.
cluster_start_time is the time you start the cluster. You can fetch Presto logs using the above log location using the approximate start time of the cluster.
You can also get it by running a Presto command. When you run a Presto command, the log location is reported under the Logs tab.
For example, on AWS you’ll see something like this:
Log location: s3://mydata.com/trackdata/logs/logs/presto/910/2019-06-17_13-48-45/
Started Query: 20190610_092450_00096_bucas Query Tracker
Query: 20191060_092450_00096_bucas Progress: 0%
Query: 20190610_092450_00096_bucas Progress: 0%
2019-06-17_13-48-45 is the cluster start time; there are sub-directories for the coordinator and worker nodes.
However, for Azure blog storage and data lake, the log location is still in the
cluster_instance_id. In Azure blob storage, the path would be something likewasb://mycontainer@myaccount.blob.core.windows.net/logs/presto/95907, and in Azure Data Lake storage (ADLS), the path would be something likeadl://mydatalake.azuredatalakestore.net/logs/presto/95907.
Why are new nodes not being used by my query during upscaling?
New nodes are available only to certain operations (such as TableScans and Partial Aggregations) of queries already in progress when the nodes are added. For more information, see this explanation of how autoscaling works in a Presto cluster.
Where can I find different Presto metrics for monitoring?
Understanding the Presto Metrics for Monitoring describes the list of metrics that can be seen on the Datadog monitoring service. It also describes the abnormalities and actions that you can perform to handle abnormalities.
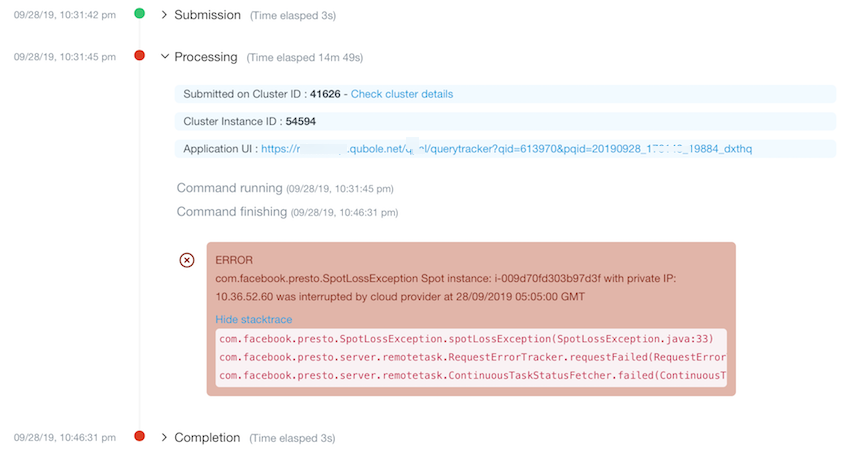
How do I know if the query has failed due to a Spot loss?
Whenever a node encounters Spot loss, the query info of all queries running on that node is updated
with information about the spot node interruption. The query may or may not fail due to the spot interruption. The
affected query’s query info displays the warning: Query may fail due to interruption of spot instance: <Instance ID>
with private IP: <IP> by cloud provider at: <Spot Interruption Time> GMT.
The error about Query that has failed due to a Spot loss is displayed in the exception stack trace. This is an example of the Spot loss error in the stack trace.

Query failures due to Spot node interruptions are detected faster using information about the Spot interruption time from the Cloud Provider.
Where can I find the Presto Server Bootstrap logs?
An ec2-user can see the Presto Server Bootstrap logs in /media/ephemeral0/presto/var/log/bootstrap.log.
The QDS account admin can see the Presto Server Bootstrap logs by logging into the cluster when the
Customer Public SSH Key is configured in the cluster’s security settings. For more information, see Advanced Configuration: Modifying Security Settings (AWS).
For information on how to log into the clusters, see:
Does Qubole Presto support Hive ACID tables?
Hive ACID tables is currently supported in Presto version 317. For more information, see Using ACID Tables in Presto.
How can I optimize the Presto query?
The following are some guidelines you can consider adopting to make the most of Presto on Qubole:
Check the health of the cluster before submitting a query and ensure that the Presto master is working and the cluster resources such as CPU, memory, and disk are not over utilized (> 95%).
Check the storage format of the data you are querying. Prepared data (columnar format, partitioned, statistics, and so on) provide better performance. Contact your Admin for further advice.
Ensure that PREDICATES and LIMIT statements are used when querying large datasets, doing large data scans, or joining multiple tables.
Consolidate small files into bigger files asynchronously to reduce network overheads.
Collect dataset statistics such as file size, rows, and histograms of values to optimize queries with JOIN reordering.
Enable runtime filtering to improve the performance of INNER JOIN queries.
Enable automatic selection of optimal JOIN distribution type and JOIN order based on table statistics.
Use broadcast/replicated JOIN (Map-side JOIN) when build side tables are small.
Use aggregations over DISTINCT values to speed up the query execution.