Spark Structured Streaming
Spark Structured Streaming is a scalable and fault-tolerant stream processing engine built on the Spark SQL engine. Structured Streaming provides fast, scalable, fault-tolerant, end-to-end exactly-once stream processing. You can express your streaming computation the same way you would express a batch computation on static data. You can use the Dataset/DataFrame API in Scala, Java, Python or R to express streaming aggregations, event-time windows, stream-to-batch joins, etc. The Spark SQL engine runs it incrementally and continuously, and updates the final result as streaming data continues to arrive. The computation is executed on the same optimized Spark SQL engine.
Spark Structured Streaming on Qubole:
Is supported on Spark 2.2 and later versions.
Supports long-running tasks. Spark structured streaming jobs do not have 36 hours timeout limit unlike batch jobs.
Allows you to monitor health of the job.
Provides end-to-end exactly-once fault-tolerance guarantees through checkpointing.
Supports various input data sources, such as Kafka, File system (S3), Kinesis, and Azure event hub.
Supports various data sinks, such as Kafka, File system (S3), Kinesis, and Spark tables.
Provides direct S3 writes for checkpointing.
Rotates and aggregates Spark logs to prevent hard-disk space issues.
Supports Direct Streaming append to Spark tables.
Provides optimized performance for stateful streaming queries using RocksDB.
Supported Data Sources and Sinks
Spark on Qubole supports various input data sources and data sinks.
Data Sources
Kafka
File system (S3)
Kinesis
For more information about Kinesis, see https://www.qubole.com/blog/kinesis-connector-for-structured-streaming/.
Amazon S3-SQS
Amazon S3-SQS source optimizes on the expensive S3 listing that occurs every microbatch. S3-SQS source lists files by reading them from Amazon SQS instead of directly listing them from S3 bucket. As a prerequisite, you must configure the S3 bucket to send Object Created notification to SQS queue. Amazon S3-SQS source is supported on Spark 2.4 and later versions.
Azure event hub
Data Sinks
Kafka
File system (S3)
Kinesis
Spark tables.
Note
Kinesis, Kafka, and file system (S3) client jars are available in Spark in Qubole as part of the basic package.
For more information about the data sources and data sinks, see the following documentation:
When running structured Spark streaming jobs, you must understand how to run the jobs and monitor the progress of the jobs. You can also refer to some of the examples from various data sources on the Notebooks page.
Running Spark Structured Streaming on QDS
You can run Spark Structured Streaming jobs on a Qubole Spark cluster from the Analyze and Notebooks pages as with any other Spark application.
You can also run Spark Structured Streaming jobs by using the API. For more information, see Submit a Spark Command.
Note
QDS has a 36-hour time limit on every command run. For streaming applications this limit can be removed. For more information, contact Qubole Support.
Running the Job from the Analyze Page
Navigate to the Analyze page.
Click +Compose.
Select Spark Command from the Command Type drop-down list.
Select the Spark language from the drop-down list. Scala is the default.
Select Query Statement or Query Path.
Compose the code and click Run to execute.
For more information on composing a Spark command, see Composing Spark Commands in the Analyze Page.
Running the Job from the Notebooks Page
Navigate to the Notebooks page.
Start your Spark cluster.
Compose your paragraphs and click the Run icon for each of these paragraphs in contextual order.
Monitoring the Health of Streaming Jobs
You can monitor the health of the jobs or pipeline for long running ETL tasks to understand the following information:
Input and output throughput of the Spark cluster to prevent overflow of incoming data.
Latency, which is the time taken to complete a job on the Spark cluster.
When you start a streaming query in a notebook paragraph, the monitoring graph is displayed in the same paragraph.
The following figure shows a sample graph displayed on the Notebooks page.

Additionally, you can monitor the streaming query using Spark UI from the Analyze or Notebooks UI, and Grafana dashboards.
Monitoring from the Spark UI
Depending on the UI you are using, perform the appropriate steps:
From the Notebooks page, Click on the Spark widget on the top right and click on Spark UI.
From the Analyze page, click on the Logs tab or Resources tab. Click on the Spark Application UI hyperlink.
The Spark UI opens in a separate tab.
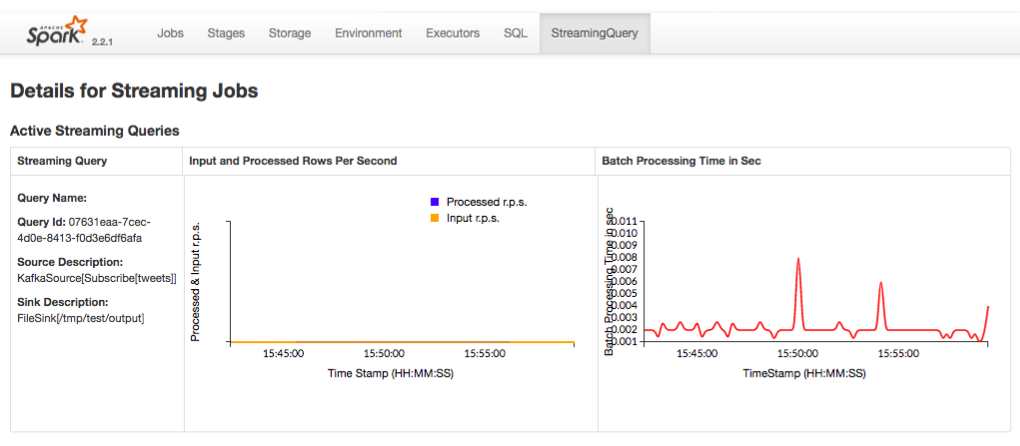
In the Spark UI, click Streaming Query tab.
The following figure shows a sample Spark UI with details of the streaming jobs.

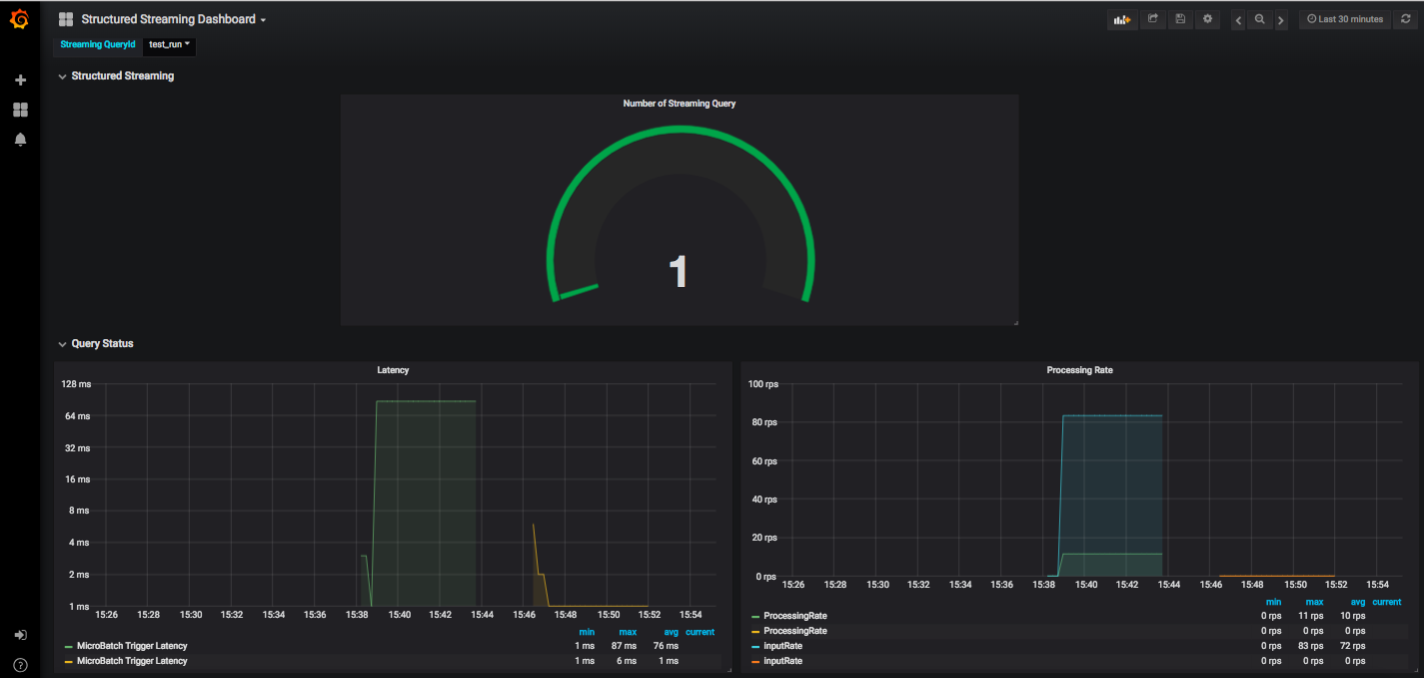
Monitoring from the Grafana Dashboard
Note
Grafana dashboard on Qubole is not enabled for all users by default. Create a ticket with Qubole Support to enable this feature on the QDS account.
Navigate to the Clusters page.
Select the required Spark cluster.
Navigate to Overview >> Resources >> Prometheus Metrics.
The Grafana dashboard opens in a separate tab.
The following figure shows a sample Grafana dashboard with the details.

Examples
You can refer to the examples that show streaming from various data sources on the Notebooks page of QDS or from the Discover Qubole Portal.
You can click on the examples listed in the following table and click Import Notebook. Follow the instructions displayed in the Import Notebook pop-up box.
Data Source
Examples
S3 Source
Kafka Source
Amazon MSK
Kinesis Source
Azure EventHub
You can also access the examples from the Notebooks page of QDS.
Log in to https://api.qubole.com/notebooks#home (or any other env URL).
Navigate to Examples >> Streaming.
Depending on the data source, select the appropriate examples from the list.
Limitations
The Logs pane displays only the first 1500 lines. To view the complete logs, you must log in to the corresponding cluster.
Historical logs, events, and dashboards are not displayed.
Spark Structured Streaming on Qubole in Production
Handling Eventual Consistency Issues
Direct Checkpointing
Checkpointing in Object Stores such as S3 is recommended for running streaming workloads in the cloud. Such object stores might not be HDFS-compliant and can lead to EC issues, which is a challenge to productionize and run Structured Streaming applications reliably on the cloud.
Spark Structured Streaming on Qubole has implemented Direct Write Checkpointing for object stores, which ensures reliability. This feature is supported on Spark 2.3 and later versions.
For more information, see Reliable Structured Streaming on the Cloud with Direct Write Checkpointing.
Downstream ETL Operations using Other Engines
When output files are written to S3 in Structured Streaming, task re-attempts can result in duplicate task data files. Spark ignores such duplicate files but other engines such as Hive, Presto, etc. consider those files for downstream ETL operations. With this fix, such duplicate files are deleted and the task re-attempts that are caused due to Eventual Consistency (EC) are reduced. This issue is fixed in Spark 2.3.2 and 2.4.0 versions.
Note
This fix is not enabled for all users by default. Create a ticket with Qubole Support to enable this feature on the QDS account.
Optimize Performance of Stateful Streaming Jobs
Spark Structured Streaming on Qubole supports RocksDB state store to optimize the performance of stateful structured streaming jobs. This feature is supported on Spark 2.4 and later versions.
You can enable RocksDB based state store by setting the following Spark Configuration before starting the streaming query:
--conf spark.sql.streaming.stateStore.providerClass = org.apache.spark.sql.execution.streaming.state.RocksDbStateStoreProvider.
Set the --conf spark.sql.streaming.stateStore.rocksDb.localDir=<tmp-path> configuration, tmp-path is a path in a local storage.
The default State Store implementation is memory based and the performance degrades significantly due to JVM GC issues when the number of state keys per executor increases to few millions. In contrast, RocksDB based state storage can easily scale up to 100 million keys per executors.
You cannot change the state storage between query restarts. However, if you want to change the state storage then you must use a new checkpoint location.