Using Qviz Options
The Qviz framework provides various UI elements that enables you to select among the different visualization types, and also enables you to customize the visualization by using the Plot Builder option. These options are available for visualizations that are created with dataframes (Spark and pandas), and with SQL magic.
Visualization Types
Qviz framework provides the following visualization types:
Table
Pie Chart
Line Chart
Area Chart
Bar Chart
Bubble Chart
Scatter Chart
Horizontal Bar chart
Donut Pie Chart
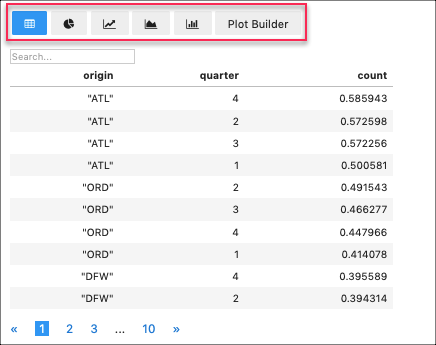
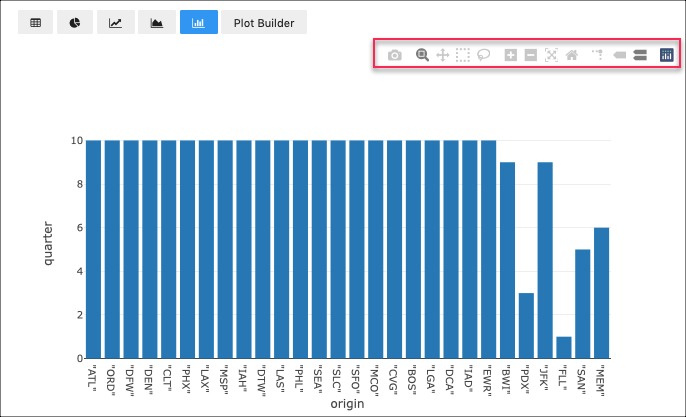
The Qviz framework displays a toolbar with certain options, such as downloading plot as a png file, zoom in, zoom out, etc on the top-right corner of the chart. These options vary depending on the chart type. When viewing the visualization as a table, you can also use pagination to view the data across pages.
Click on the required visualization type to plot the required charts.
The following illustration shows a sample Table visualization type.
The following illustration shows a Bar chart with the highlighted toolbar.
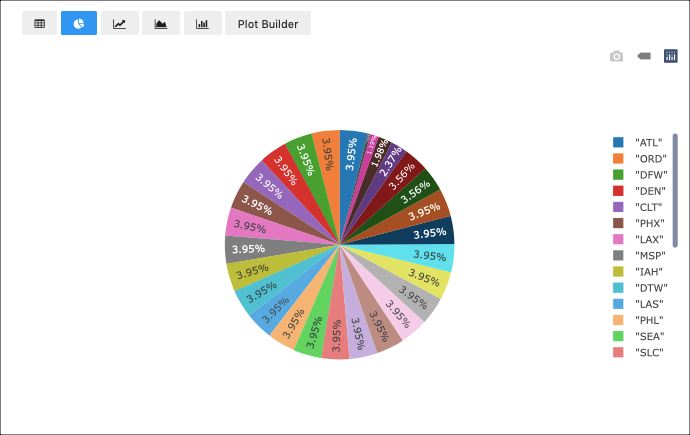
The following illustration shows a sample Pie chart.
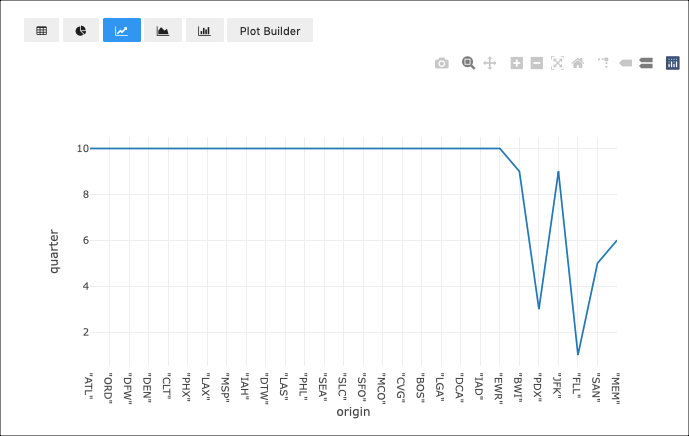
The following illustration shows a sample Line chart.
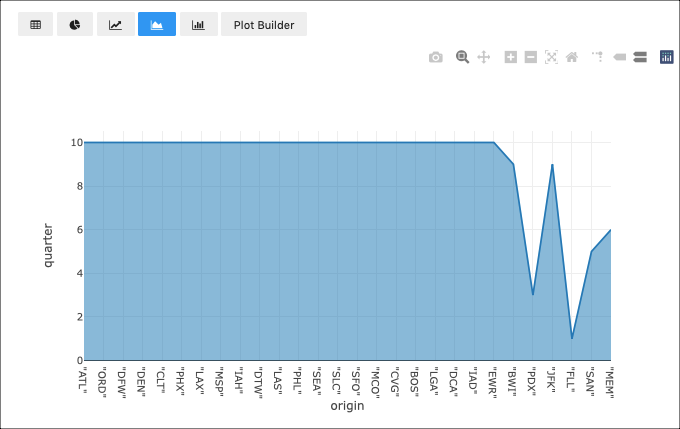
The following illustration shows a Area chart.
Customizing Visualization Types
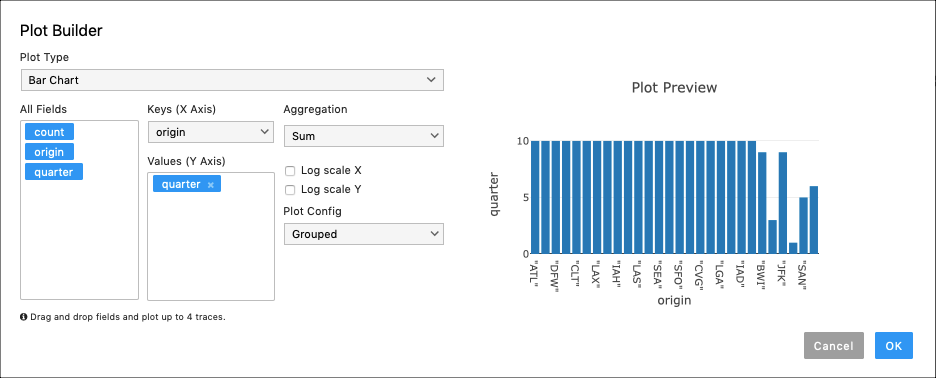
You can use the Plot Builder option of the Qviz framework to customize a visualization. The Plot Builder option provides the following capabilities:
Change plot types.
Plot multiple (upto 4) traces by using the drag and drop action.
Select the traces for X and Y axis.
Use aggregate functions, such as, sum, min, max, avg, and count.
Change the axis scale to a log scale.
Use configuration option, such as, Normalized, Stacked, and Grouped for Area and Bar charts.
Preview the plot.
The following illustration shows a sample Plot Builder dialog.